New Equity Data to Inform COVID Recovery Efforts
Dear Atlas users,
The Atlas team has had an exciting month of sharing our data tools and analysis with community partners throughout the Bay Area. As local restrictions loosen and businesses begin to ramp back up, we will continue to equip equity advocates with the research necessary to ensure a just economic recovery. Here are some updates:
New Blog: Economic Recovery Begins by Prioritizing Racial Equity
The Covid-19 pandemic and economic shutdown brought about an unprecedented rise in unemployment in the Bay Area and across the country, particularly for low-income people of color and immigrants. Our new analysis highlights how these communities not only suffered the greatest job losses but were also less likely to receive PPP loans early on and more likely to work in essential jobs than their White counterparts. For the region to recover and thrive, policymakers should prioritize investments in historically underserved communities, connect unemployed and low-wage workers with good jobs, and support businesses owned by people of color and immigrants. Find the analysis here.
Atlas Team Presents Data to Spur an Equitable Recovery to The Commonwealth Club of California
The Commonwealth Club hosted a webinar on May 18, "Building an Inclusive Recovery Across the Bay Area," led by Fred Blackwell, CEO of the San Francisco Foundation. Panelists included Jamila Henderson from the Atlas team who shared findings on how Covid-19 has impacted people of color and low-income communities. Experts and advocates, Chris Iglesias of Unity Council and Tomiquia Moss of All Home, shared their perspectives on what is needed to ensure an equitable recovery for all Bay Area residents. Check out the webinar recording here.
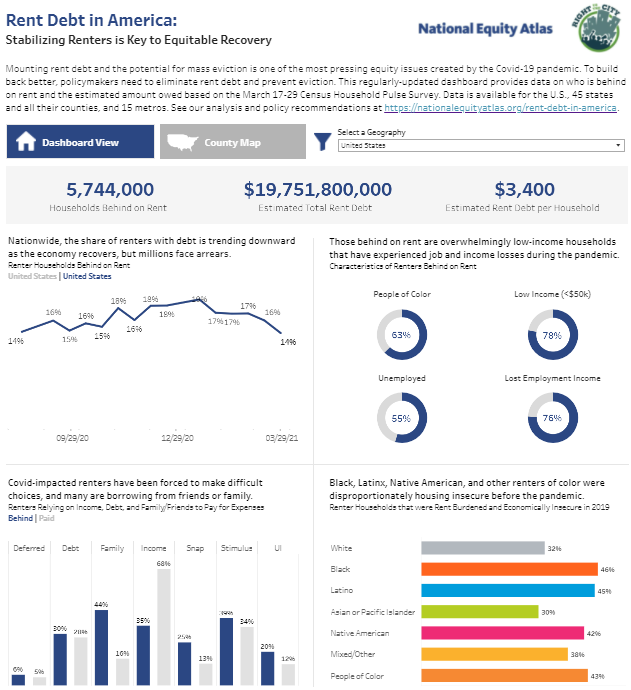
California Tenants Face Barriers in Accessing Rent Relief, Survey Finds
In partnership with Housing NOW and BARHII, PolicyLink surveyed 177 workers conducting intake and outreach for California’s emergency rental assistance programs. We found that tenants are facing numerous challenges accessing relief, including technological and language barriers, difficulty supplying the necessary documentation of income losses, and fear of landlord harassment/retaliation or immigration enforcement. The analysis also includes the latest data from our Rent Debt Dashboard, which shows that Californian renter households owe an average of $4700 in back rent. Check out the findings here.
The Cost of Being Californian: New Data on Economic Security from the Insight Center
Through their Family Needs Calculator, the Insight Center found that the hourly wage needed for a family with one parent, one preschooler, and one school-age child to meet basic needs is over $70 an hour in some Bay Area counties. In addition, the percentage of Black households struggling to make ends meet in Marin County increased from 56 percentage in 2018 to 95 percentage in 2021. The Atlas team regularly uses the Family Needs Calculator in our work and are thrilled to have this updated dataset. You can access the report here.
Create Your Own Factsheets on the Racial Equity Data Lab
Last month, we launched the Racial Equity Data Lab, a new space on the National Equity Atlas where you can create unique data displays, dashboards, and maps. The Lab has everything you need to tell your community’s equity story using Atlas data: ready-to-use datasets, data visualization basics, and a step-by-step guide to get you started. We held a webinar for the Lab release on May 6th where our Atlas team members Selena Tan and Sarah Treuhaft were joined by USC Equity Research Institute Director Manuel Pastor. Check out the webinar recording here.
In the News
This month, The Business Journal and Pacific Sun covered our findings on household rental debt in the Bay Area. New Hope Network cited our data on Bay Area indigenous communities.
Thank you,
Bay Area Equity Atlas team