#6bb4ef

Using Data to Protect Renters from Eviction; Join Us to Learn More About the New National Equity Atlas

August 11, 2020

Dear Atlas users,

We hope you and your loved ones are staying well during this difficult time. Since the release of the updated National Equity Atlas, our team has been hard at work producing data and analysis to support local advocacy efforts and sharing the Atlas with communities and leaders across the field. Last week, Angela Glover Blackwell, PolicyLink Founder in Residence, delivered the keynote address at the Community Indicators Consortium’s 2020 Virtual Impact Summit, noting that "If you want change, you must use data to understand the change you need. Until we understand how we treat Black people, we are not dealing with oppression and exclusion in America.” Sarah Treuhaft, VP of Research at PolicyLink, also presented on the use of equity data for building community power and policy change. And we shared the newly revamped Atlas and debuted the Racial Equity Index in a July 29 webinar (view the recording here). Here are a few other highlights:

New Analyses: Eviction Risk Factsheets Power Local Organizing

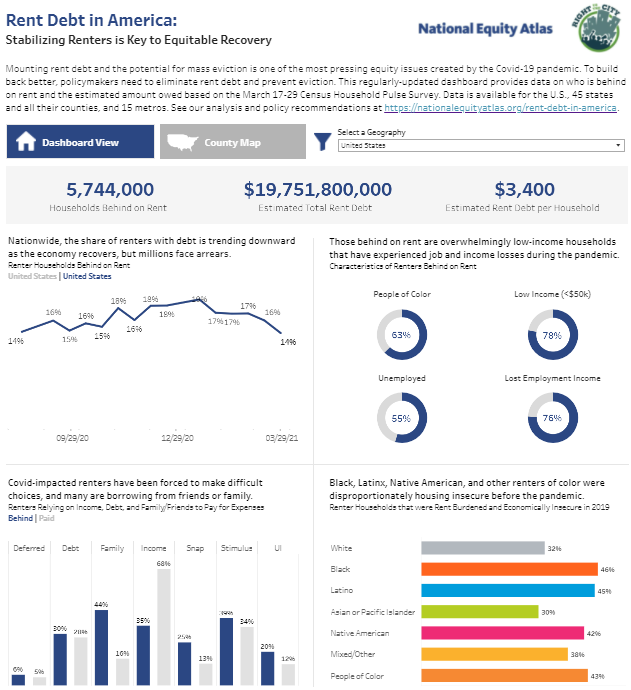
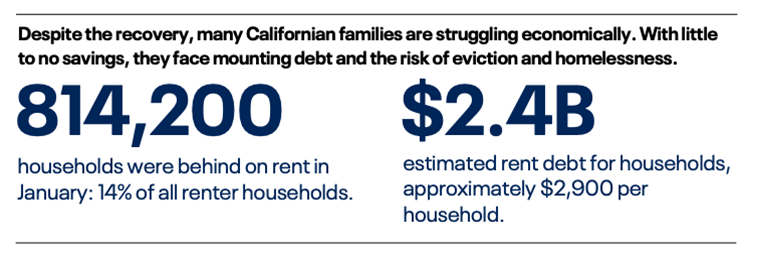
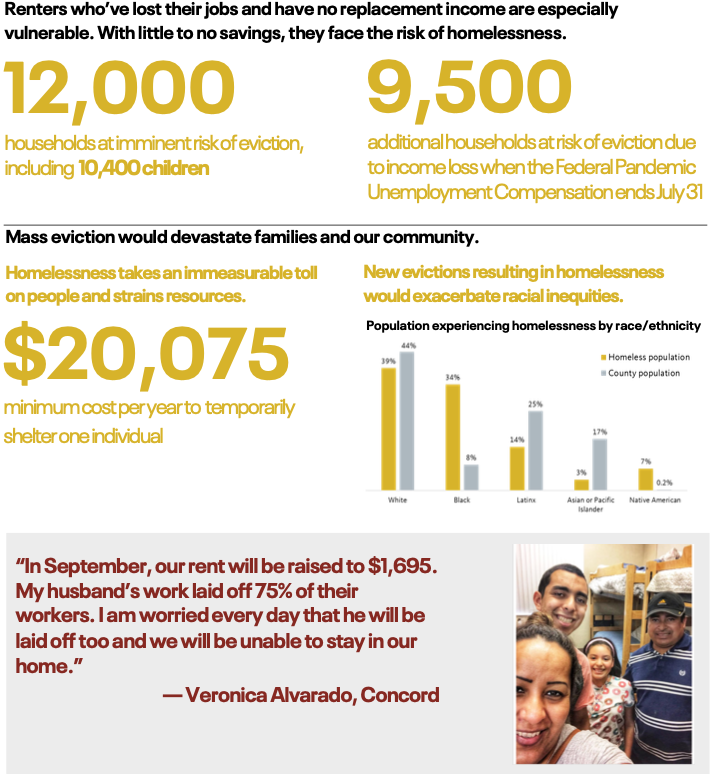
In recent weeks, the Atlas team and our community partners have produced a series of factsheets on eviction risk in counties and states nationwide. The factsheets include data on how many households are currently at risk of eviction and homelessness, which households are rent burdened (disaggregated by race, ethnicity, and gender), as well as the voices of tenants impacted by the economic downturn. Our first factsheet for Contra Costa County, produced in partnership with Raise the Roof Coalition, was used in organizing efforts to extend the eviction moratorium. Since then, we have produced factsheets for Florida, California, and Sonoma and San Mateo counties, with many more factsheets currently in the works. All factsheets will be available on the National Equity Atlas.


You’re Invited: Disaggregating Data with the National Equity Atlas

Join the Atlas team on August 19 to learn how to unlock the power of disaggregated data for your city, region, or state. The National Equity Atlas offers unparalleled data disagreggation by race/ethnicity, gender, nativity, ancestry, and other characteristics to inform and support local efforts to advance racial and economic equity. This webinar will equip participants with the know-how to access, understand, share, and use this disaggregated data to foster more equitable communities. Register now.
 

Atlas in the News: Providing Deeply Disaggregated Data to Power the Equity Movement

NC News Daily used our new Racial Equity Index to look at the state of equity in North Carolina cities and identify key gaps and policy priorities. As Abbie Langston, Senior Associate at PolicyLink, noted, “Raleigh and Durham are among the 20 cities with the highest prosperity scores for Black residents on the index. But even in these places where people of color are doing relatively well, we still see deep and persistent inequities that must be addressed explicitly.” Another article from software company Tableau lifted up our work in discussing racial equity data visualizations, emphasizing the need for deep disaggregation by race and ethnicity. “If you don’t disaggregate, you miss a lot of what is happening for some segments of the population, especially people that have been marginalized and discriminated against,” explained Sarah Treuhaft. The Atlantic, Fast Company, and Philanthropy News Digest wrote articles about the Atlas this month while other reporters have drawn on our data to better understand issues like eviction risk, the racial wealth gap, and job losses due to Covid-19. Find a complete list of coverage here.

New Data Dashboard Tracks Rent Debt in States, Regions, and Counties

April 27, 2021

Dear Atlas users,

With the conviction of Derek Chauvin, the Atlas team stands in solidarity with George Floyd’s family. True justice would be a world where George Floyd was never murdered. We remain committed to supporting the fight for racial equity and systemic justice through our analyses, disaggregated data tools, and campaign support. Here are some updates:

Join Us for the Launch of the Racial Equity Data Lab on May 6

The National Equity Atlas is America’s most detailed report card on racial and economic equity – and now we’re democratizing our data even further help you to build your own custom Atlas-powered data dashboards. Join us on May 6 at 12:00pm Pacific / 3:00 Eastern for the launch of the Racial Equity Data Lab, a new space on the Atlas where you can create unique data displays, dashboards, and maps. The Lab has everything you need to tell your community’s equity story using Atlas data: ready-to-use datasets, data visualization basics, and a step-by-step guide to get you started. We’ll also share a starter dashboard focused on the importance of raising the minimum wage. For example, in Dallas, fewer workers earn at least $15 now than in 1980, due entirely to racial inequities. Join this webinar to hear more about the Lab, how we’re using it to support equity campaigns, and how to create custom data visualizations for your community. Register now!

New Rent Debt Dashboard Tracks Covid Impacts to Support Broad Renter Protections

Stabilizing renters experiencing housing insecurity is key to an equitable recovery and lasting prosperity for our communities, so we partnered with Right to the City Alliance to equip advocates and policymakers with timely, local data on the extent of renter debt and the characteristics of households affected by it. Our regularly updated data reveals that the renters behind on rent owe an average of $3,400 – and the vast majority of them are low-wage workers, disproportionately people of color, who’ve suffered job and income losses due to the economic shutdowns. Without sufficient eviction protection, debt relief, and financial support, these Covid-impacted renters will be left behind. Visit the rent debt dashboard to see the data for your community, and check out our accompanying analysis.

In the News

This month, Forbes highlighted the Atlas as a key tool for advancing racial equity on a municipal level. Denver7 TV aired a story featuring the findings and implications of our rent debt analysis, and Planetizen also highlighted the data in our rent debt dashboard. Government Affairs called for the Biden Administration to develop equity indicators modeled after the Atlas. And ABC Cleveland, Energy News Network, and Akron Beacon Journal all cited our data in their coverage of racial inequities. See a complete list of media coverage here.

- The National Equity Atlas team at PolicyLink and the USC Equity Research Institute (ERI)

New Analysis Reveals Massive Renter Debt in California

March 25, 2021

Dear Atlas users,

The Atlas team stands in solidarity with the Asian and Pacific Islander (API) community in this moment of heightened discrimination, hatred, and violence. As we reckon with our nation’s long history of racism and xenophobia, disaggregated data is crucial for advancing racial equity and justice. Here are a few updates:

Ancestry Matters: Racial Subgroup Data in the National Equity Atlas

Asian and Pacific Islander activists and organizations have warned about the ‘model minority’ myth for decades. While the API population as a whole often fares above average on socioeconomic indicators, such metrics render invisible subgroup populations within the API community who face barriers to economic opportunities and inclusion. To illustrate the diversity of experiences and outcomes within broad racial/ethnic groups, the Atlas includes subgroup data for several of our economic opportunity and connectedness indicators, including median wage, unemployment, the percentage of workers making $15/hour, disconnected youth, homeownership, and educational attainment. To view this data, navigate to your indicator of choice and then select “by ancestry” from the Breakdown menu.

New Data Shows that 1 in 7 California Renter Households Are Behind on Rent

In partnership with Housing Now!, the Atlas team released an updated fact sheet analyzing rent debt in California (also available in Spanish), as well as a rent debt fact sheet for the Bay Area. We found that over 814,000 households were behind on rent in January, or 14 percent of all renter households. Renters owe an estimated $2.4 billion in back rent (an average of $2,900 per household). Eliminating rent debt is critical to equitable recovery: the vast majority of renters with debt are low-income, Covid-impacted renters of color. The new data was featured during #TenantTuesday to raise awareness about California’s rent forgiveness program, which will provide crucial relief.

You’re invited: Using Disaggregated Data to Advance Workforce Equity

You’re invited to join the National Equity Atlas team and our partners at the National Fund for Workforce Solutions for a three-part webinar series on using disaggregated data to develop high-impact workforce strategies for racial equity. Through our Advancing Workforce Equity project, we spent two years working closely with local leaders to analyze tailored workforce data, identify the key drivers of inequity, and prioritize actionable strategies to advance equity through policy, programs, and investments. In this webinar series we’ll share the tools and approaches that guided this research, along with lessons from the field.

  • Part 1: Accessing and Exploring Relevant Data from the National Equity Atlas
    April 14, 11 am – 12 pm PT / 2 pm – 3 pm ET
    This session will focus on using the National Equity Atlas to access and understand deeply disaggregated data for your city, region, or state. Register here.
  • Part 2: Analyzing Systemic Drivers of Inequity
    April 21, 11 am – 12 pm PT / 2 pm – 3 pm ET
    The second session will equip attendees with strategies to analyze disaggregated data and identify the root causes of inequitable workforce outcomes. Register here.
  • Part 3: Developing High-Impact Workforce Equity Strategies
    April 28, 11 am – 12 pm PT / 2 pm – 3 pm ET
    Finally, the third session of this webinar series will feature lessons and tools developed through our work with local leaders in the Advancing Workforce Equity project. Register here.

In the News

This month, news outlets including Yahoo Finance and the Washington Post covered our indicators, while The Guardian, The Mercury News, and The Press Democrat covered our analysis of renter debt in California. Find a complete list of media coverage here.

And don’t miss “Putting People First: Reimagining OUR Economy,” a recent episode of the Radical Imagination podcast featuring Manuel Pastor and Saru Jayaraman on the fight for one fair wage and a solidarity economy. PolicyLink and its partners at Unfinished invite you to reflect and respond to the question, "What does an economy that puts people first look like?" Submit your responses at RadicalImagination.us, or on social media using #RadicalImagination and #ThisIsUnfinished

- The National Equity Atlas team at PolicyLink and the USC Equity Research Institute (ERI)

Year In Review: Democratizing Data for Equitable Recovery

Dear Bay Area Equity Atlas Users:

January 11, 2021

Dear Bay Area Equity Atlas Users:

Happy New Year from the Bay Area Equity Atlas team! This has been a year of tremendous economic and social turmoil for our region and the nation. The Covid-19 pandemic and the outcry against police brutality and systemic racism following the murder of George Floyd pushed structural racism to the forefront of public consciousness and elevated equity in local policy debates. Throughout 2020, we worked to equip advocates and the public with relevant, deeply disaggregated local data to inform policy and systems changes to advance racial equity.

Covid-19 Dashboard, Frontline Workers Analysis Reveal Pandemic’s Impact on Communities of Color

To track the community-level impact of the pandemic, we launched a daily-updated dashboard in December that provides ZIP code-level data on total Covid cases from the four Bay Area counties that publish such detailed geographic data. The dashboard reveals how neighborhoods with large Latinx and Black populations have been hardest hit and can be used to inform targeted relief and recovery strategies. We also analyzed the Bay Area’s 1.1 million-strong essential workforce and found that Black, Filipinx, women of color, and immigrant workers are disproportionately represented in essential industries and vulnerable to economic and health risks.


Partnering with Bay Area Organizers to Assess Eviction Risk, Support Tenant Protections

We produced county-level fact sheets estimating the number of renter households at risk of eviction in the midst of the current economic crisis. Our Contra Costa county factsheet, produced in July in partnership with the Raise the Roof Coalition, found that nearly 22,000 households were at risk of eviction, and helped to secure an extension of the county’s eviction moratorium from July to September. We produced similar resources for San Mateo and Sonoma counties in partnership with the People’s Alliance of San Mateo County and the North Bay Organizing Project, we as well as for the state of California (with the Housing Now! coalition). Find them here.

Tracking Racial Equity in Political Representation, Police Use of Force, and Income

In February, we analyzed the latest data on the race and gender of top local elected officials and found that while the region is making progress on political representation, people of color — especially the Latinx and Asian or Pacific Islander communities — remain underrepresented in elected office. We also reviewed the use of force indicator in the Atlas and found that Black residents are disproportionately the victims of police violence. Of the nearly 200 incidents in 2016 and 2017, one-fifth involved Black people even though they make up just 6 percent of the region’s population. We also analyzed the typical income classifications used to inform housing policy (e.g. 50 and 80 percent of Area Median Income) and found that nearly half of all residents are considered low income. Black and Latino residents are overrepresented in very-low-income households while White residents are overrepresented among high-income households.

Democratizing Equity Data in the Region

We continued to share the Atlas resource with community leaders across the region, albeit virtually, including presenting our data with the Oakland Department of Violence Prevention and the Bay Area Regional Health Inequities Initiative, and hosting community trainings with the All-in Alameda County initiative, Boston Private Bank in San Francisco, and the Silicon Valley Council of Nonprofits.

Atlas in the News

Our data and reports have been covered by media outlets including the San Francisco ChronicleSFGate, Mercury News, Palo Alto Online, East Bay Times, Patch, San Francisco Business Times, Tableauand more.

We have big plans for 2021, including new analyses, tools, and partnerships, so stay tuned. Thank you for your continued interest in our work!

The Bay Area Equity Atlas team

New Dashboard Tracks Covid Cases by ZIP Code

Dear Bay Area Equity Atlas Users:

The results of this year’s elections are largely due to a historic groundswell of activism led by people of color and grassroots community organizations across the country, including the Bay Area. As the movement for racial equity continues to build momentum, the Atlas team is proud to partner with local leaders at the forefront of policy change. Our research this month highlights the urgent need to center low-income communities and people of color in both the ongoing Covid-19 recovery and in the long-term vision for a just and fair society. Here are some updates:

Atlas Dashboard Reveals Majority Black and Latinx Neighborhoods Hardest Hit by Covid-19

To track the community-level impact of the pandemic, the Atlas team launched a new automatically-updated dashboard that provides ZIP code-level data on total Covid cases from the four Bay Area counties that publish such detailed geographic data: Alameda, San Francisco, Santa Clara, and Sonoma. By analyzing Covid cases in each ZIP code in relation to the share of Black and Latinx residents, the dashboard highlights how neighborhoods with large populations of color have been hardest hit: The four ZIP codes with the highest case rates are majority-Latinx or majority-Black. Targeted strategies are needed to improve conditions in these hotspots, including community testing, better enforcement of workplace safety standards, rental supports, and continued eviction protections.

New Report Highlights Strategies for Inclusive Recovery and an Equitable Future of Work

In partnership with Burning Glass Technologies and the National Fund for Workforce Solutions, the National Equity Atlas released, Race and the Work of the Future: Advancing Workforce Equity in the United States, a comprehensive analysis of long-standing racial gaps in labor market outcomes, the economic impacts of Covid-19, and the racial equity implications of automation. We found that White workers are 50 percent more likely than workers of color to hold good jobs, and that eliminating racial inequities in income could boost the US economy by $2.3 trillion a year. We’re currently partnering with Rework the Bay to produce a similar report for the Bay Area, which will be published in spring 2021. Watch our webinar presentation and read the full report.

Eviction Risk Analyses Released for California

The Atlas team has been supporting the Our Homes, Our Health housing justice effort by producing eviction risk fact sheets for local campaigns advocating for strong renter protection and eviction moratorium policies across the country. This month, we published a factsheet for California (with Housing NOW! California), which found that 1.6 million renter households are experiencing rent shortfall and potentially facing eviction. We plan to publish a factsheet for the nine-county Bay Area later this year. Find them here.

Thank you!

The Bay Equity Atlas team

Pages