Using Disaggregated Data to Advance an Equitable Recovery
Dear Atlas Users,
As we continue to support communities in their response to the Covid-19 pandemic, we have spent the past month producing new analyses, trainings, and factsheets powered by Atlas data. Partnerships with community organizations are driving this work forward. Here are a few highlights:
Atlas Analyses Power Campaigns to Extend Eviction Moratoriums Nationwide
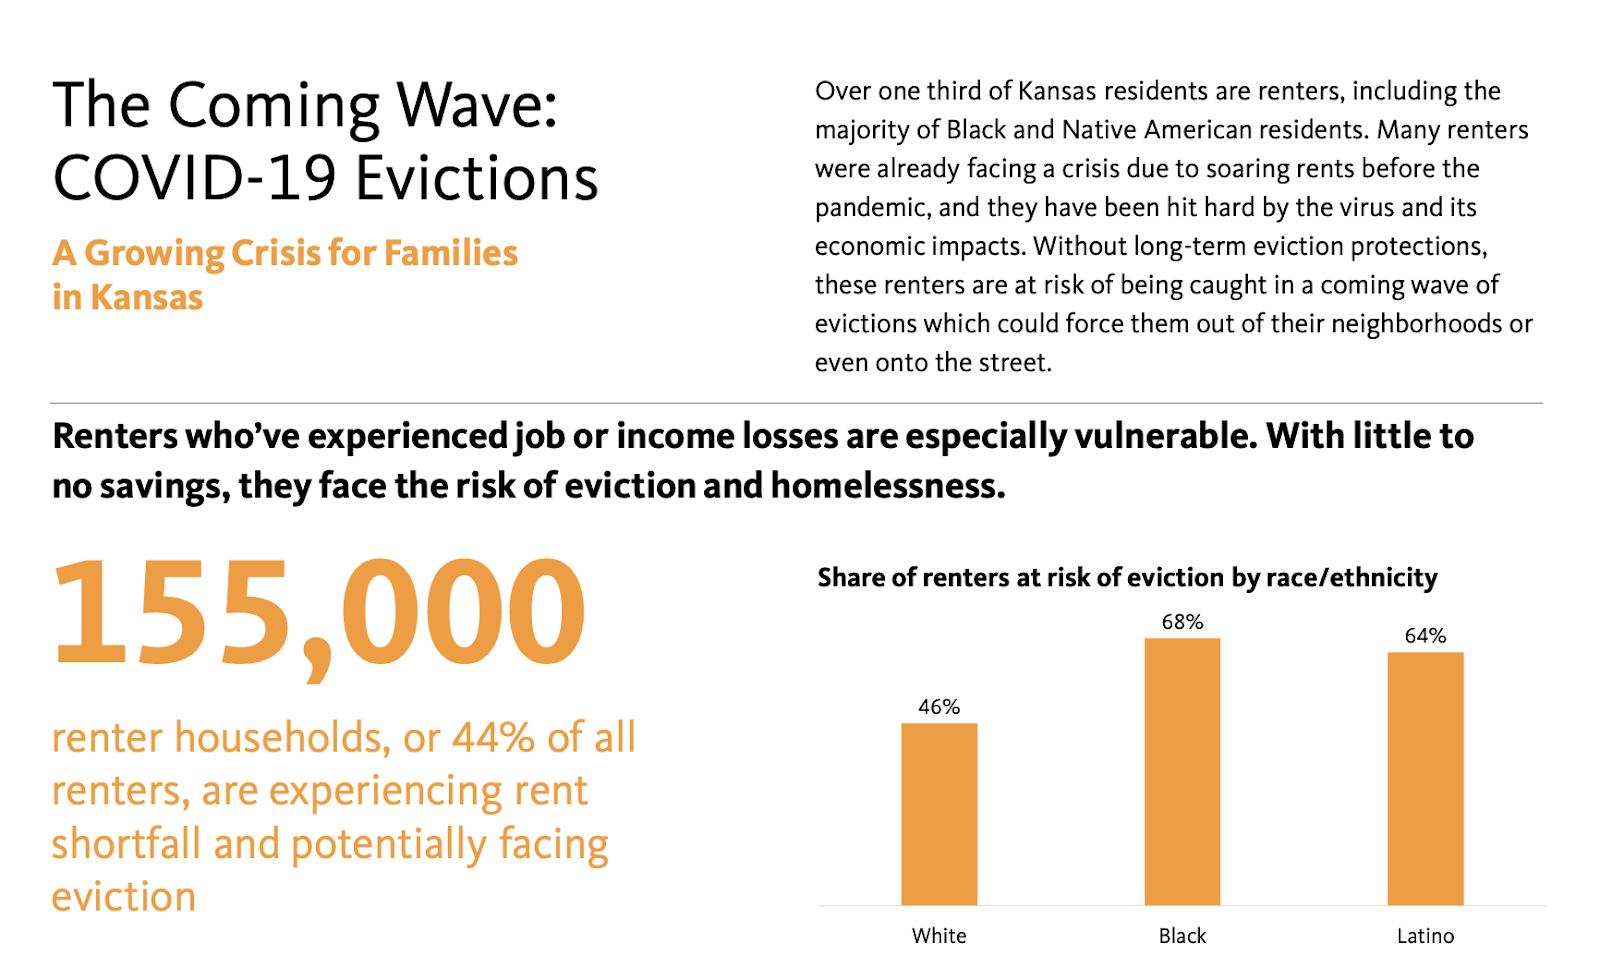
The Atlas team is supporting the Our Homes, Our Health housing justice effort by producing eviction risk fact sheets for local campaigns. These resources include data on how many households are currently at risk of eviction, which households are rent burdened and economically insecure by race/ethnicity and gender, and the first-hand experience of renters impacted by the economic downturn. This month, we published factsheets for Kansas (with Rent Zero Kansas) and Kentucky (with the Lexington Housing Justice Collaborative), with many more in the works. Find them here.
Webinar Archive: Unlocking the Insights of Disaggregated Data
This month, the Atlas team led a webinar training on how to unlock the power of disaggregated data for cities, regions, and states. We provided a step-by-step walk through of the newly revamped National Equity Atlas and our custom indicators database, which offers unparalleled data disaggregation by race/ethnicity, gender, nativity, ancestry, and more. This training was designed to equip Atlas users with the know-how to access, understand, share, and use disaggregated data to foster more equitable communities. Check out the recording here.
You’re Invited: Policy Insights for an Equitable Economic Recovery with the NY Federal Reserve
On September 24, the Federal Reserve Bank of New York will lead a conversation about the impact of Covid-19 on communities of color. The forum will focus on key policy areas necessary for an equitable recovery, including credit markets, the racial wealth gap, and workforce equity. Sarah Treuhaft, vice president of research at PolicyLink, will participate in a practitioner panel with other racial and economic equity leaders to discuss findings and policy recommendations from our recent report, Race, Risk and Workforce Equity in the Coronavirus Economy. Register for the forum here.
Thank you for your interest in our work.
-- The National Equity Atlas team at PolicyLink and the USC Equity Research Institute