See How the Bay Area’s Population Has Changed Since 2010
Dear Atlas users,
Recent headlines have focused on the Bay Area’s population loss over the last few years. But how did the region’s population — and its demographics — change during the 2010s? Our latest analysis explores the trends and what they mean for our future. Explore our findings and more updates from the Atlas:
At a Glance: The Bay Area’s Shifting Population
The Bay Area added more than half a million people between 2010 and 2020. However, our analysis of the latest decennial census data reveals that population growth during this period was uneven across the nine counties. Smaller cities in the East Bay and South Bay saw larger rates of population growth, while unincorporated areas in the North Bay and South Bay lost residents. The region’s racial and ethnic demographics are also quite different than they were a decade ago. By 2020, people of color and multiracial people comprised nearly two-thirds of all residents (64 percent), a notable rise from 50 percent in 2010. Despite this growth, Black and indigenous populations across the region have still declined.
Advocating for Language Equity in the Bay Area
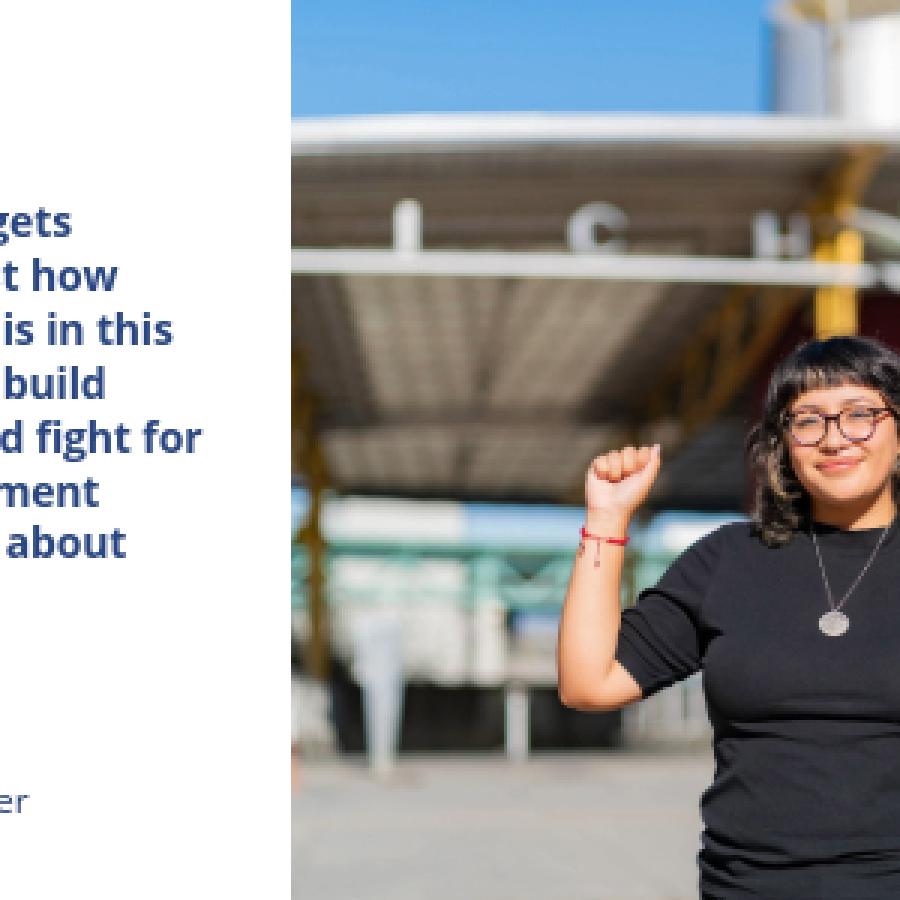
The nine-county Bay Area is home to speakers of more than 160 languages — and more than 200,000 households across the region don’t speak English well or at all. These linguistically isolated households largely speak Asian languages or Spanish. For farmworkers, many of whom speak other indigenous languages from Mexico, the situation is even more precarious: safety messages aren’t often translated into the languages they speak. Maria Salinas, a farmworker and organizer who predominantly speaks Chatino, has pushed to increase language access. In 2022, she and other farmworkers successfully advocated for the creation of an emergency operations plan that requires employers in Sonoma County to provide safety training and information to workers in their preferred languages. Learn more about her story.
ICYMI: Examining the Diversity of Bay Area Elected Officials
Our latest examination of the diversity of high-level Bay Area elected officials — mayors, city council members, supervisors, and district attorneys — reveals more people of color are running for office and winning local elections throughout the nine-county region. Between 2019 and 2023, the region’s share of elected officials of color increased from 29 percent to 37 percent. Despite this steady increase, people of color remain vastly underrepresented, given that they make up 60 percent of the region’s population. And 25 percent of Bay Area cities still have no people of color represented in their city government. Want to delve deeper? Explore our case study on the relationship between real estate interests held by local elected officials and their voting patterns on housing legislation.
Connect with Our Team
The Atlas team regularly engages with local advocates and organizations — and we’d love to. Interested in hosting a presentation or training? Contact us at info@bayareaequityatlas.org.
Thank you,
Bay Area Equity Atlas team