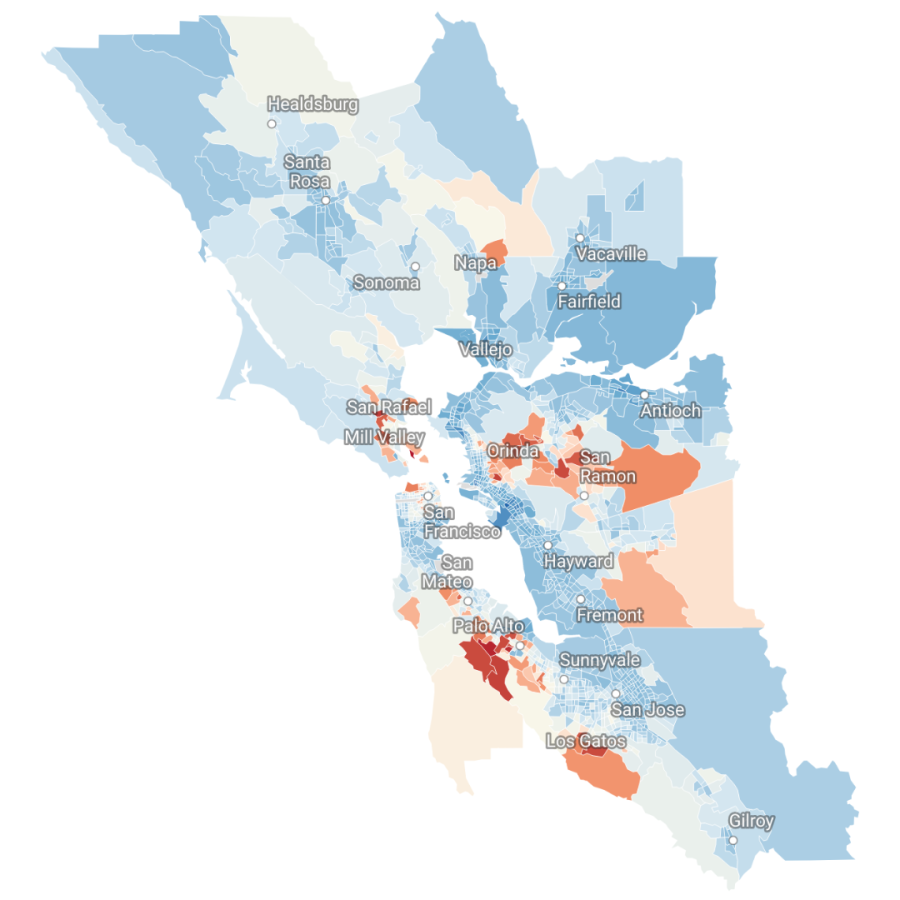
Mapping Racial and Economic Segregation in Oakland
For these maps, “high income” corresponds to the 80th percentile of the city’s household income distribution and “low income” corresponds to the 20th percentile of the household income distribution. Data comes from the 2020 five-year American Community Survey summary files from the US Census.