New Data Reveals the Bay Area’s Diversity is Not Reflected Among Top Elected Leaders
By Jamila Henderson, Michelle Huang, Justin Scoggins, and Sarah Treuhaft
Building the political voice, leadership, and influence of the communities most impacted by inequities is central to countering inequality and creating a thriving, inclusive Bay Area. One important arena for shifting power is local electoral politics. City and county mayors and councilmembers/supervisors make crucial decisions about what policies are prioritized and how resources are allocated. Who holds those seats – and the interests they represent – can make a big difference when it comes to whether equity solutions are considered and championed.
While race/ethnicity and gender alone do not determine whether an elected official will support equity solutions, leaders who come from communities that experience racism and discrimination bring important firsthand experience and knowledge about residents’ needs and concerns. Such leaders can be important advocates and champions for substantive policies that dismantle barriers and improve conditions for marginalized communities. And when these communities gain representation in the halls of power, they may feel less alienated and neglected and gain a stronger sense of belonging.
To examine how well the Bay Area’s top elected officials represent the diversity of the region’s population, we analyze the unique Diversity of Electeds indicator included in the Bay Area Equity Atlas. This dataset tracks the race/ethnicity and gender of the mayors and councilmembers of the region’s 101 municipalities, and the supervisors and district attorneys for the region’s nine counties as of May 2018 (before the last election).1 To assess representativeness, we calculate the difference between the share of that group among top elected officials and the share of that group in the total population. For example, if 60 percent of a city’s population is Latinx but only 20 percent of electeds are Latinx, the Latinx population is underrepresented by 40 percentage points (20 percent minus 60 percent = -40 percentage points).
In the maps that follow, we sort municipalities into five categories of representation based on this percentage-point difference calculated for the four largest broad racial/ethnic groups: Severely over/underrepresented (more than +20/less than -20 percentage points); Moderately over/underrepresented (+5 to +20/-5 to -20); and Represented (- 5 to +5). Because county officials also represent the residents of a municipality, county electeds are included in the tally for each city/town. This means that the typical city/town has 11 electeds included in the analysis (5 council members, 5 county supervisors, and one county district attorney). To avoid highlighting over/underrepresentation when the population base is very small, we exclude municipalities from the maps and rankings for a particular racial/ethnic group if that group comprises less than 3 percent of the overall population in the municipality. Finally, we do not report any analysis of representation for those of Native American or mixed/other race due their very small shares of both top electeds and overall population across municipalities in the region.
Regionwide, White Men are Overrepresented in Top Elected Positions
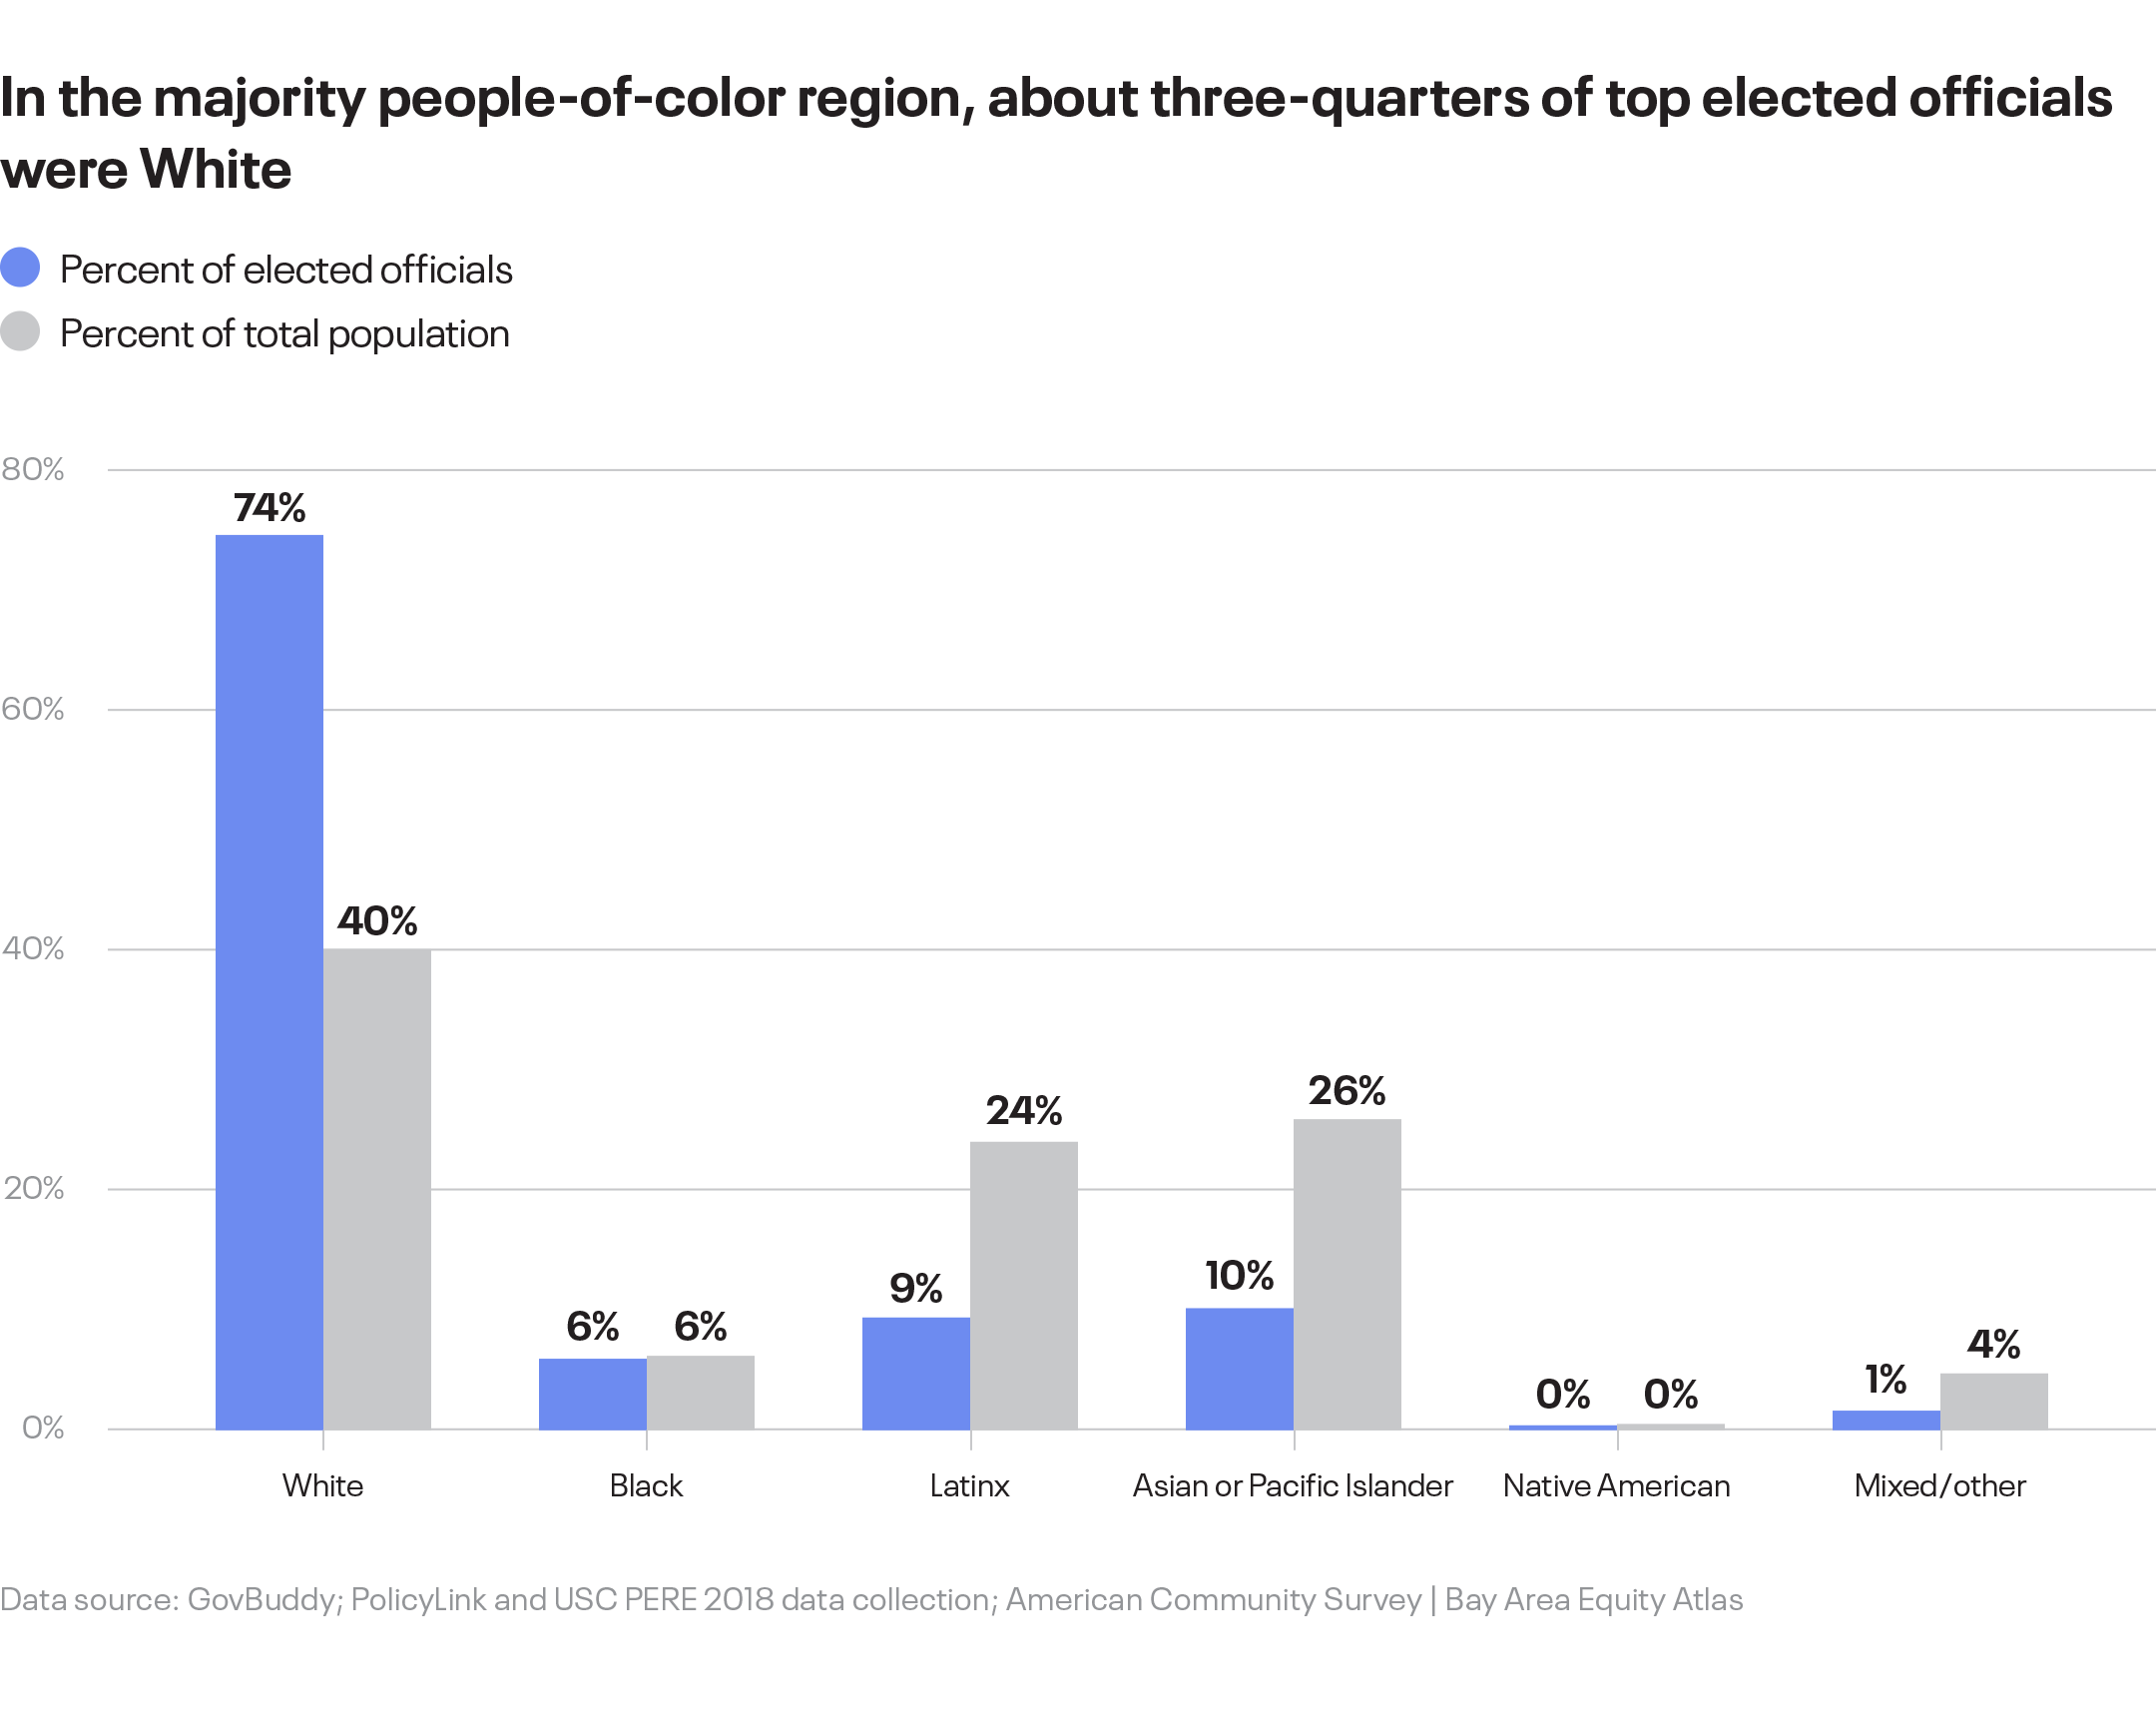
In one of the most diverse regions in the country, top political leaders remain overwhelmingly White and male. While the region is majority people of color and 40 percent of residents are White, about three-quarters of top elected leaders were White (74 percent). Among those White electeds, most were male (60 percent). Overall, 260 of the region’s 588 top city and county officials are White men (44 percent).
Although half the region’s residents are either Asian or Pacific Islander (API) or Latinx – and these populations are growing – they are highly underrepresented among top elected officials. Only 9 percent of electeds were API, and only 10 percent were Latinx. These electeds were predominantly male, and Latinas were particularly underrepresented: Of the region’s 53 Latinx electeds, only 15 of them were women (28 percent). Men represented 55 percent of the Asian or Pacific Islander electeds.
Black people make up about 6 percent of the region’s population (down from 9 percent in 1990), and accounted for the same proportion of top elected officials. Black elected officials are the only group of electeds in which women outnumbered men: 18 of the region’s 33 Black elected officials were women.
About 4 percent of the region’s population identifies themselves as multiracial or “some other race,” but only 1 percent of electeds were in this category, and all of them were male. And there were no Native American elected officials at the time of our assessment.2
White Electeds: Overrepresented Almost Everywhere
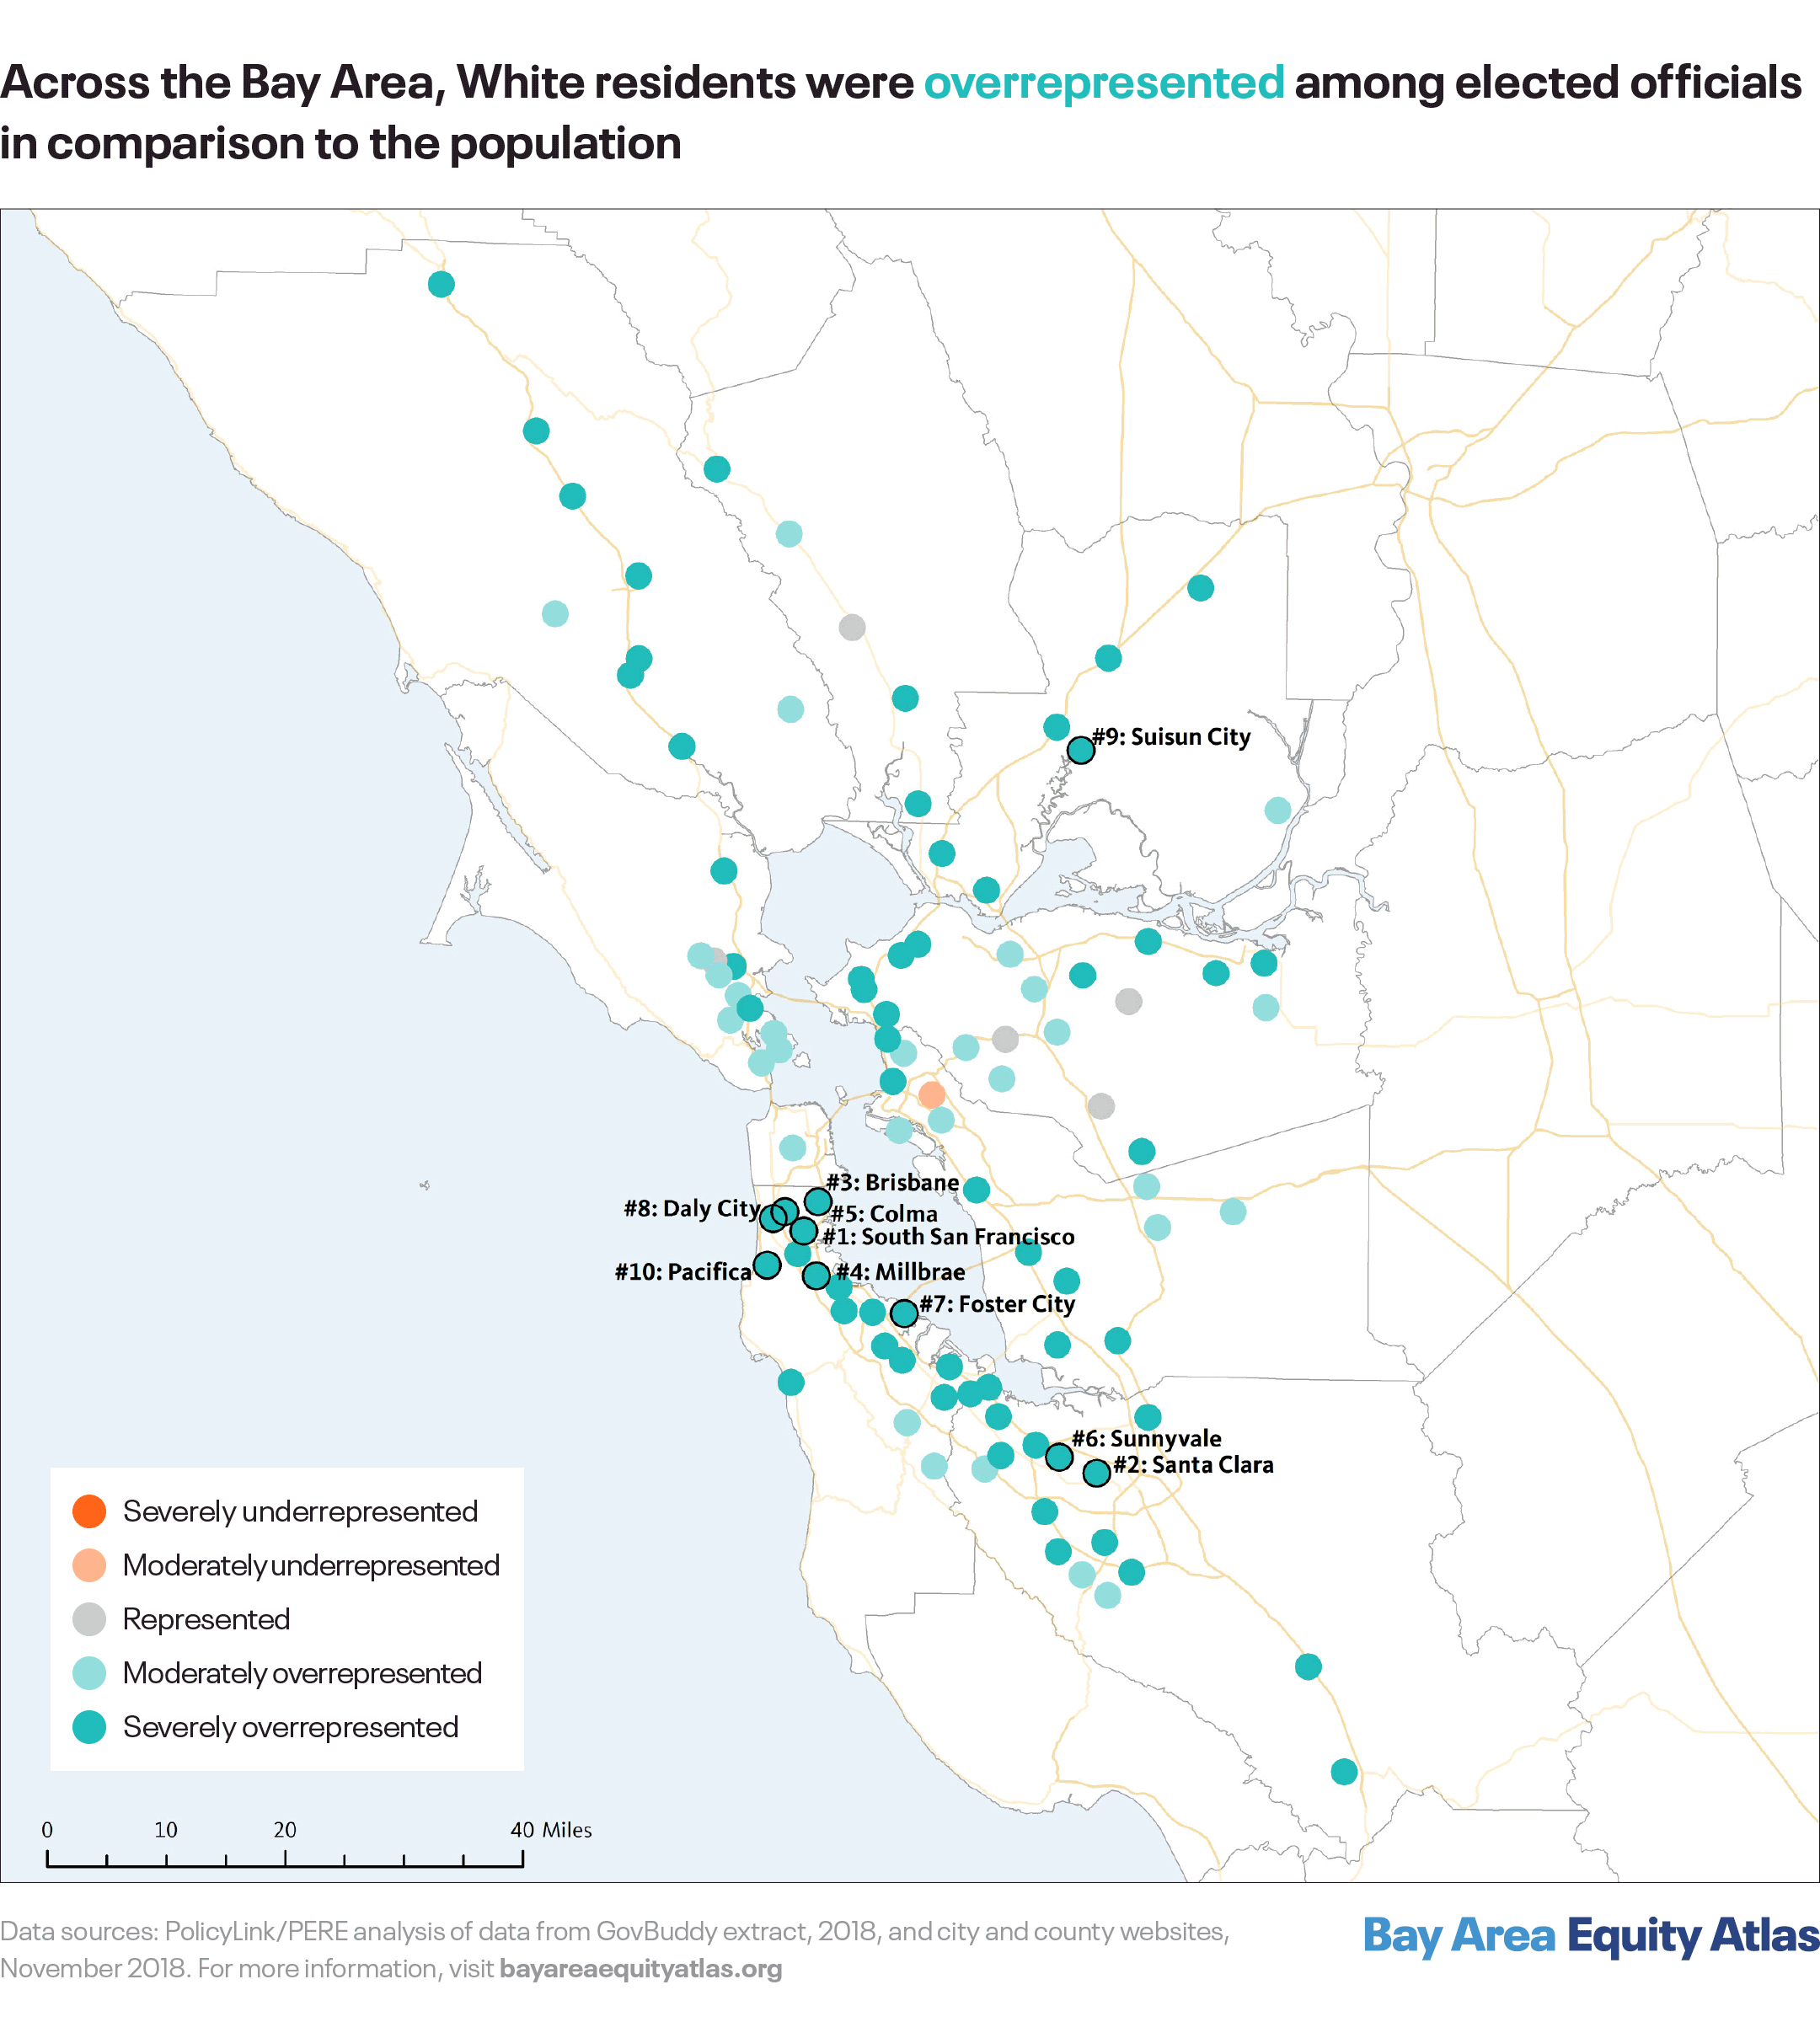
Looking across the region’s cities and towns, Whites were overrepresented among the top elected officials nearly everywhere. Whites were severely overrepresented among electeds in 66 municipalities and moderately overrepresented in 29. There were only six municipalities where the share of Whites in the population was about the same as or more than the share of Whites among top electeds.
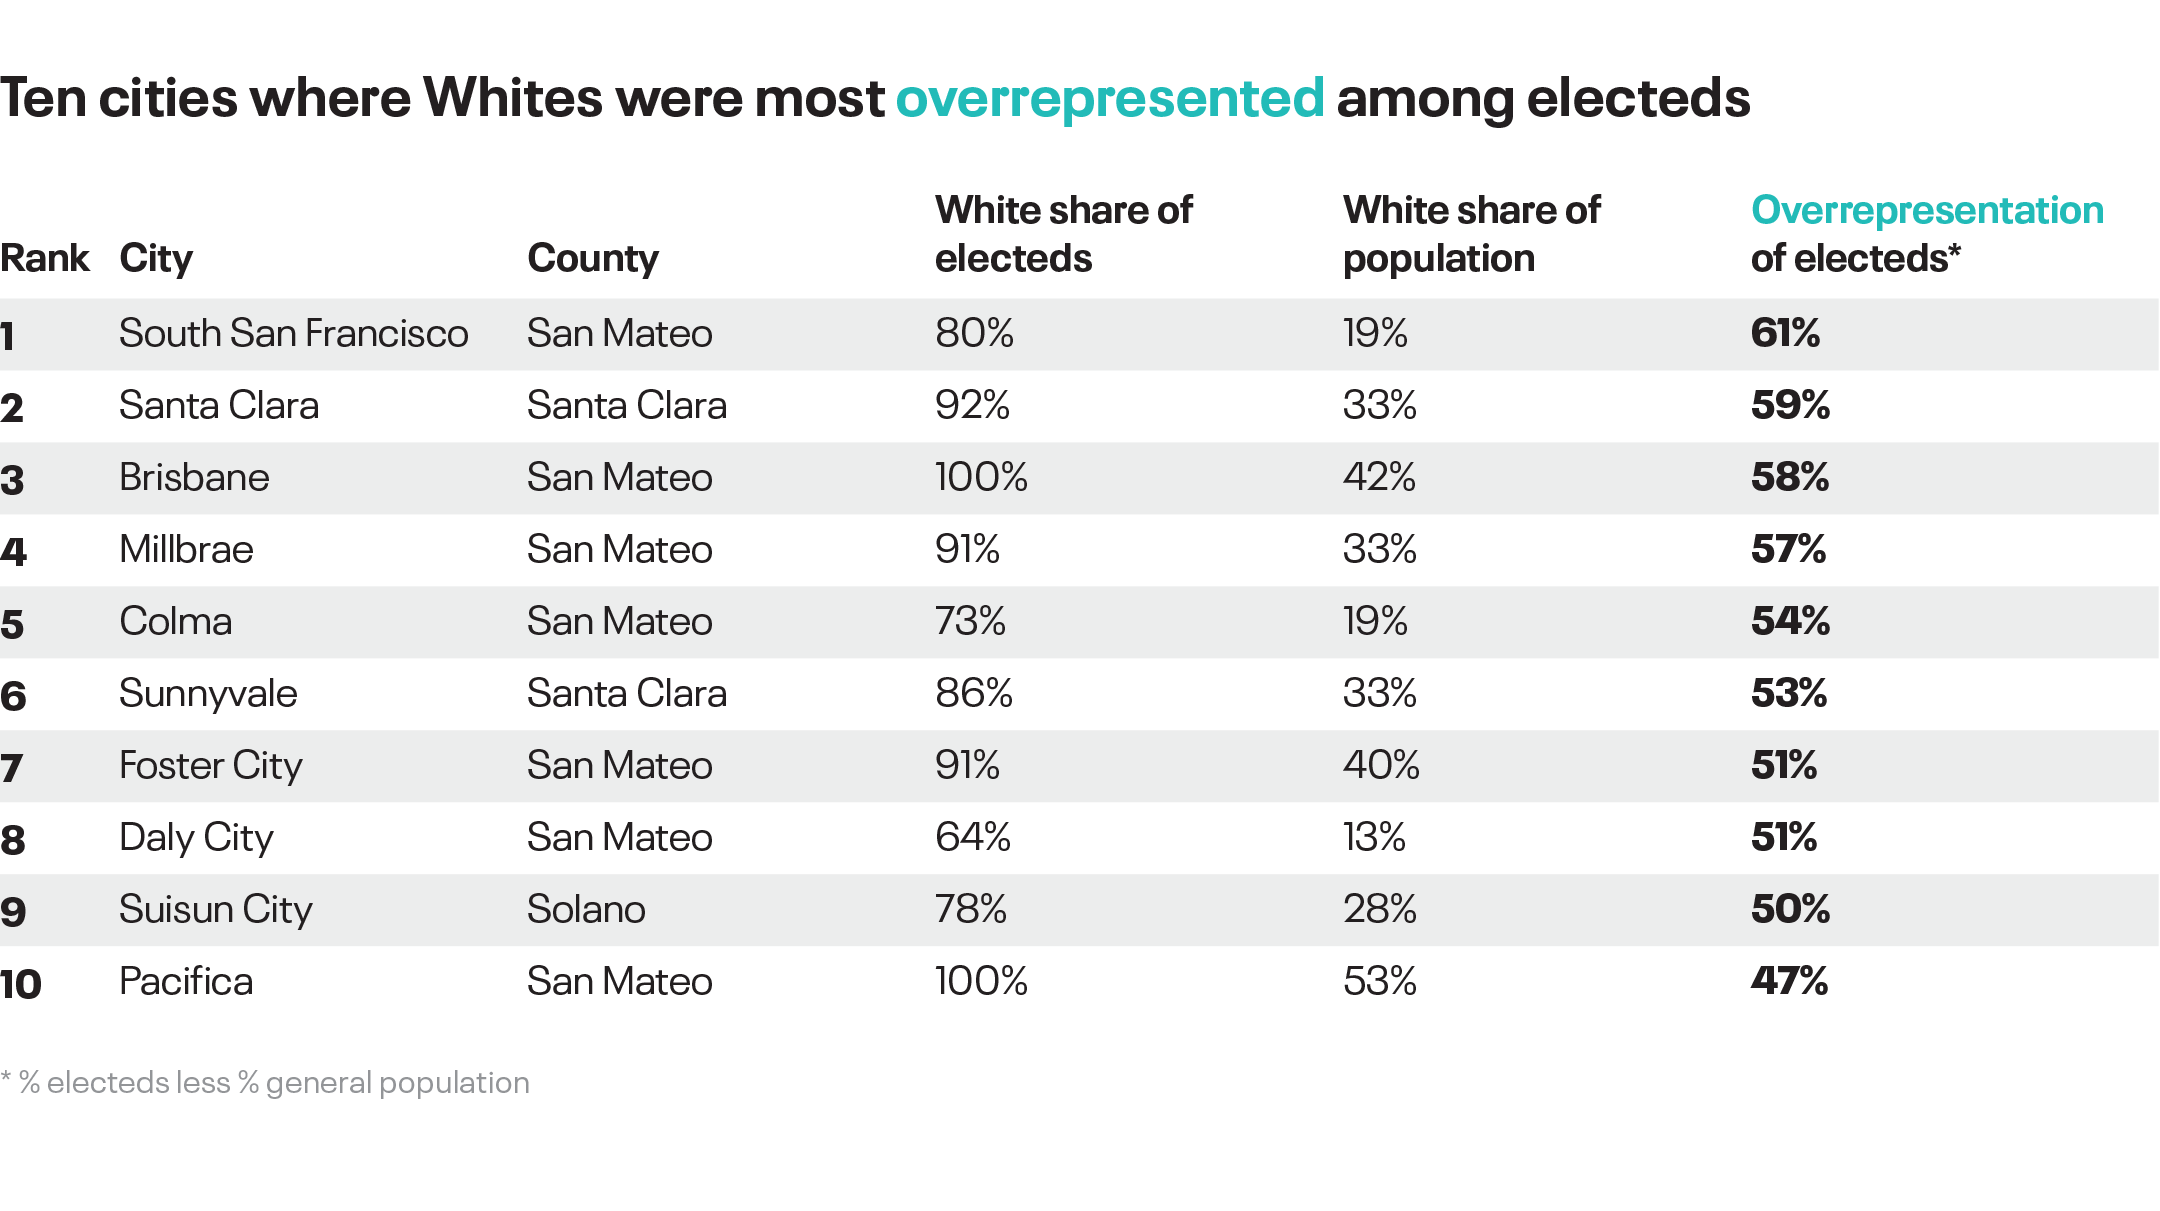
Nearly all of the municipalities with the highest overrepresentation of Whites among electeds are located in the South Bay. South San Francisco, where Whites are just 19 percent of the population and 80 percent of elected officials, has the most overrepresentation, followed closely by the cities of Santa Clara, Brisbane, and Millbrae.3
Latinx Electeds: Underrepresented Almost Everywhere
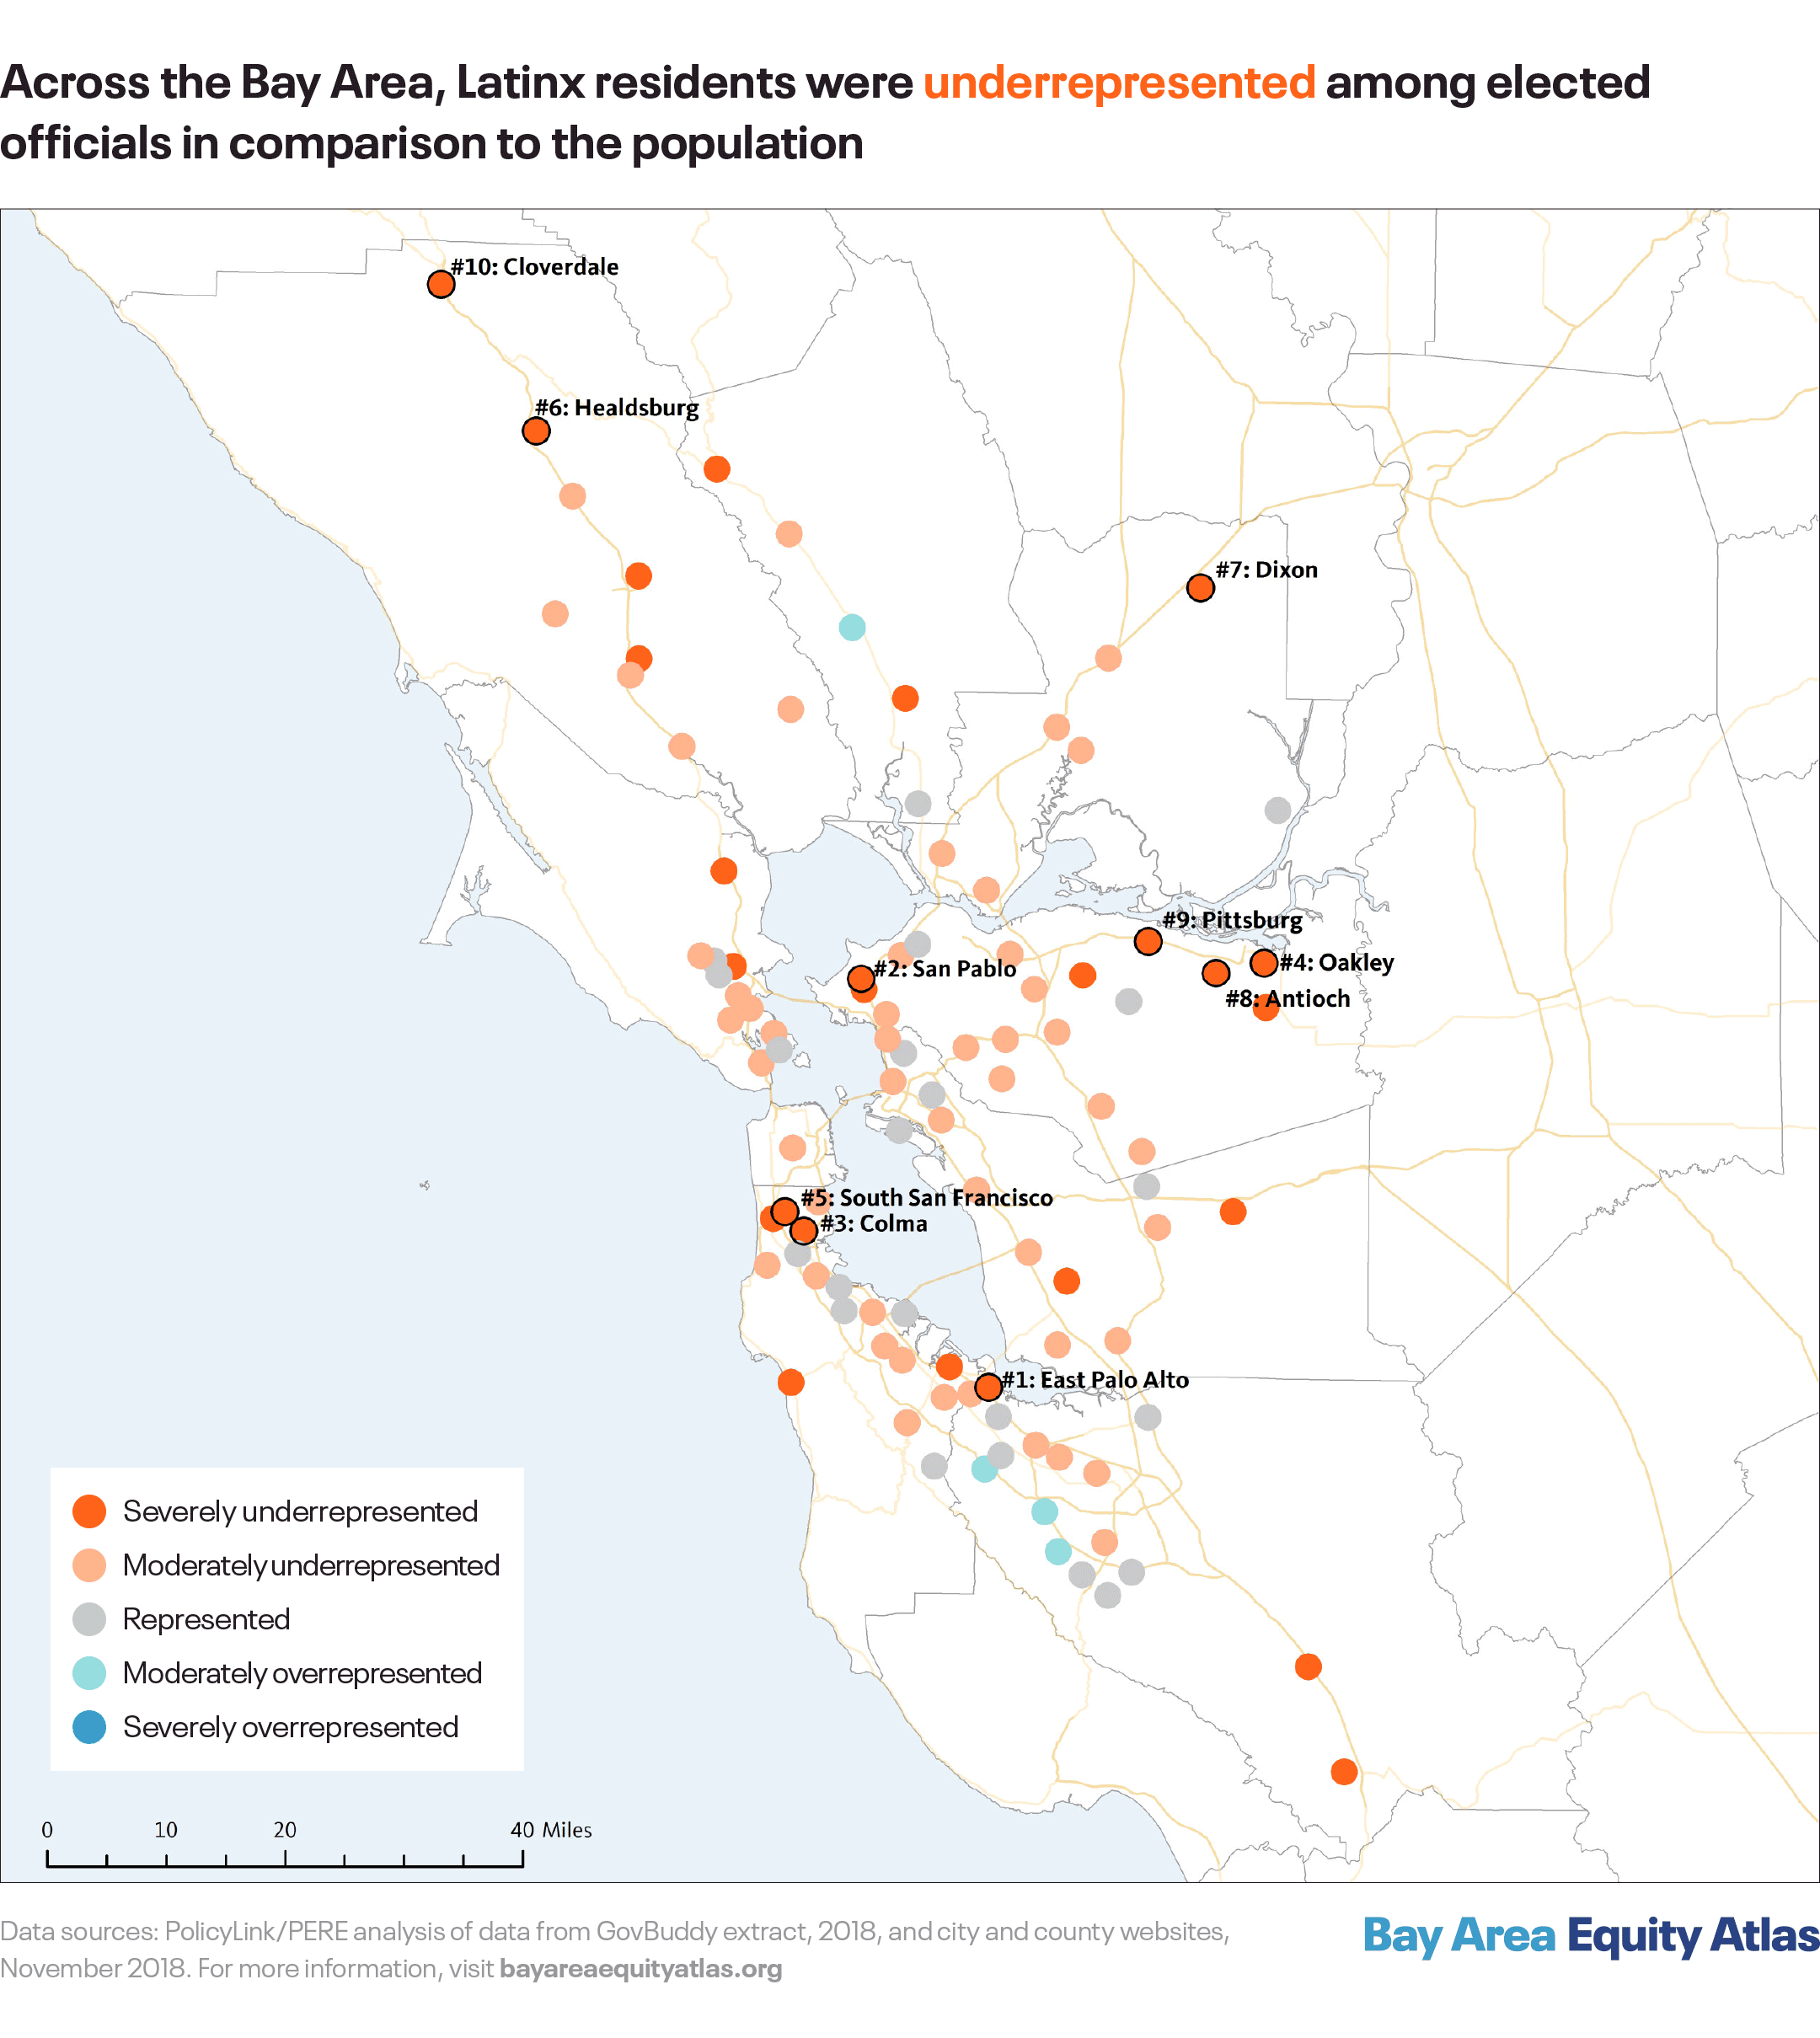
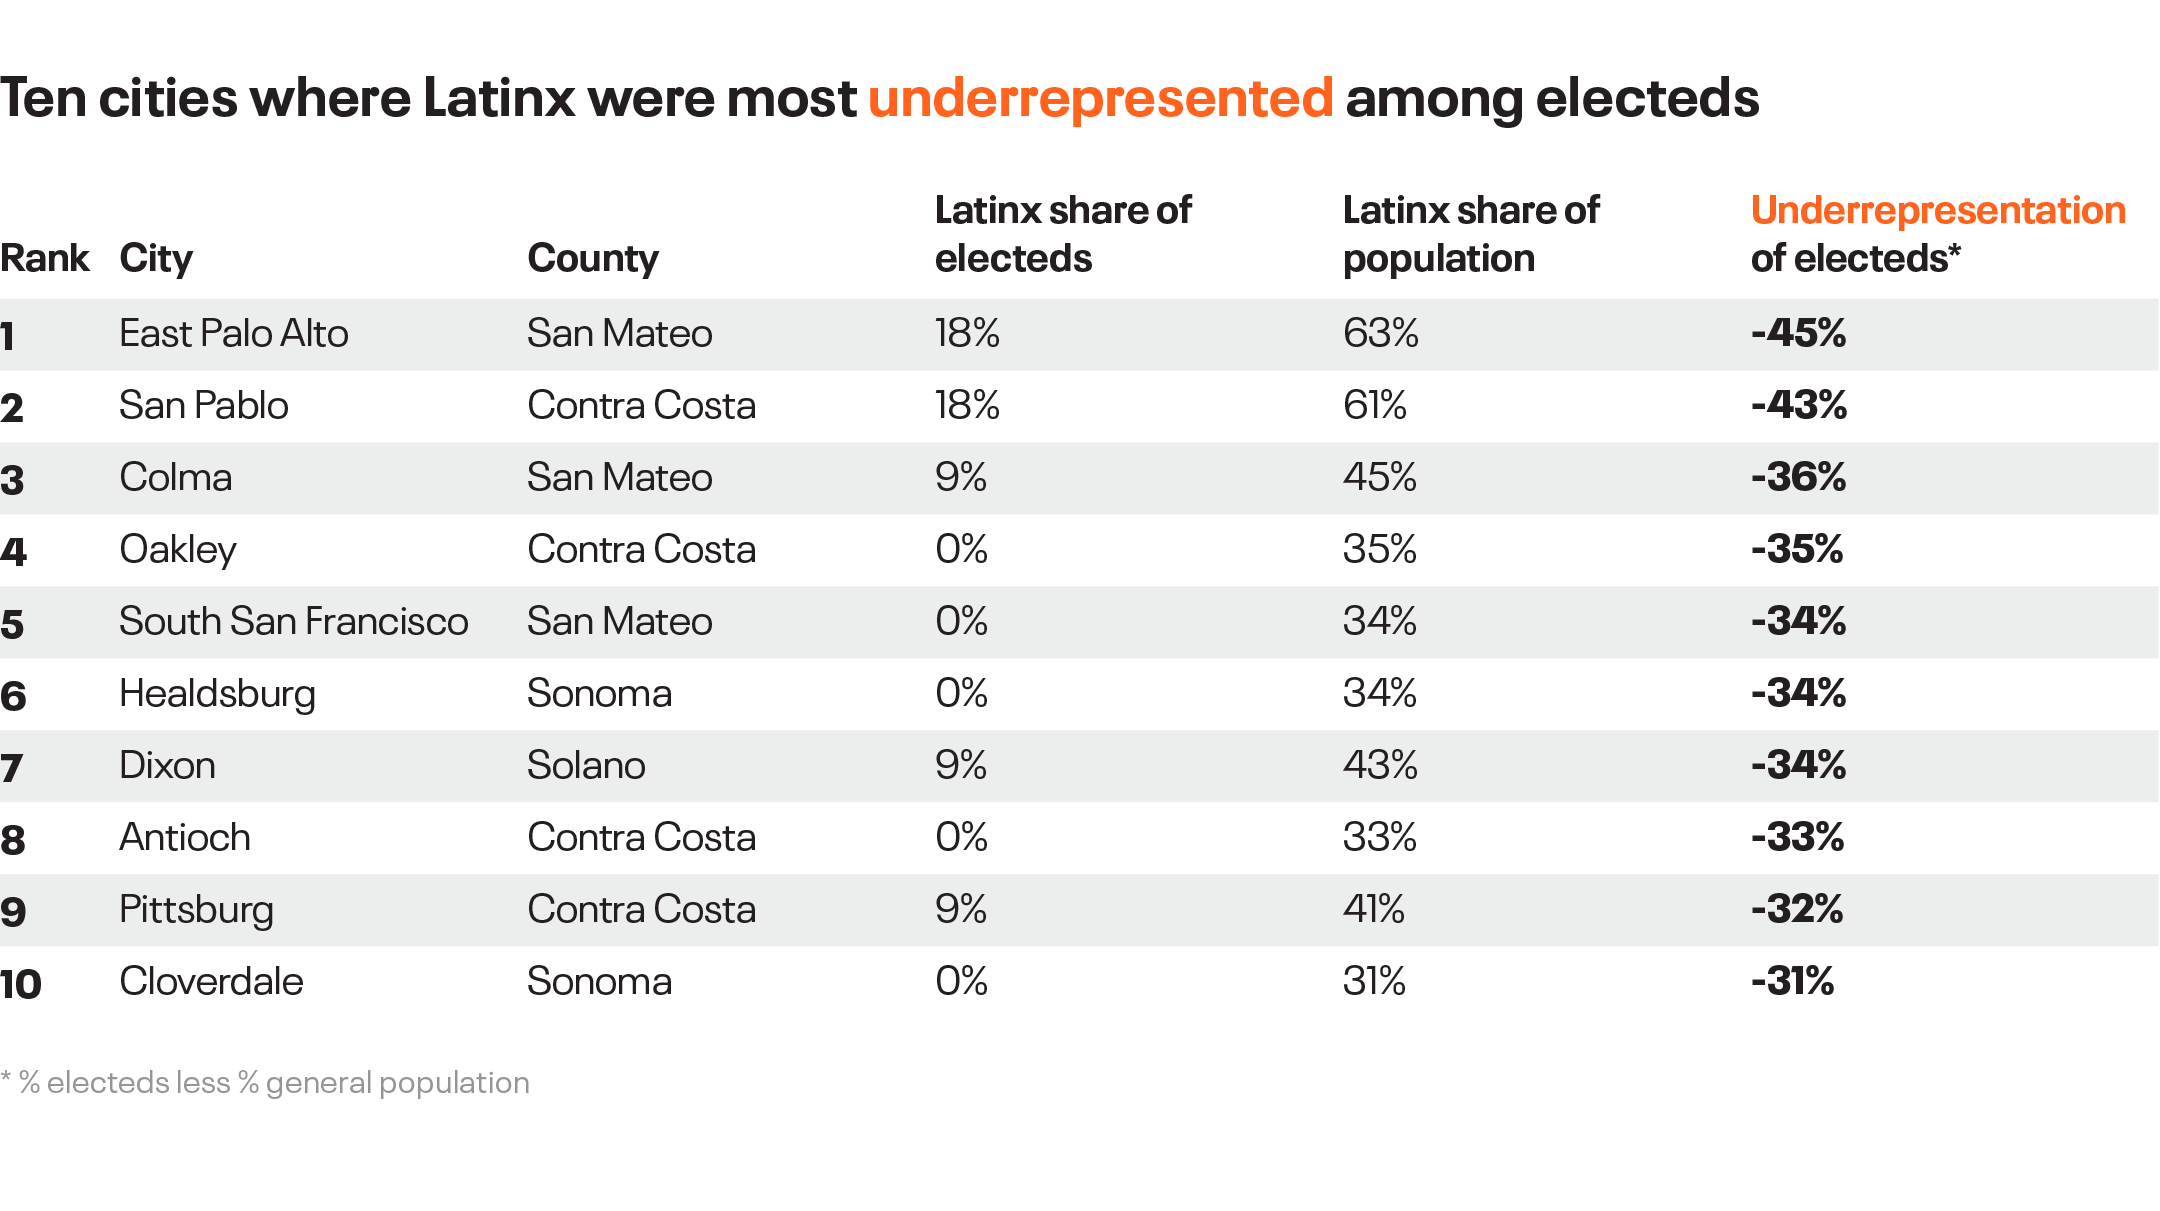
The Latinx population was underrepresented among top elected officials in most Bay Area cities and towns. As of May 2018, the Latinx population was severely underrepresented in 26 municipalities and moderately underrepresented in 49. The most severe underrepresentation was in the majority-Latinx cities of East Palo Alto and San Pablo, due in part to the fact that there were no Latinx electeds among the county supervisors or district attorneys in Contra Costa or San Mateo counties (there are also no Latinx supervisors or district attorneys in Alameda, Marin, or Sonoma counties). In four Bay Area cities (Antioch, Healdsburg, Oakley, and South San Francisco), Latinx people make up at least a third of the population, but there were no Latinx elected officials.
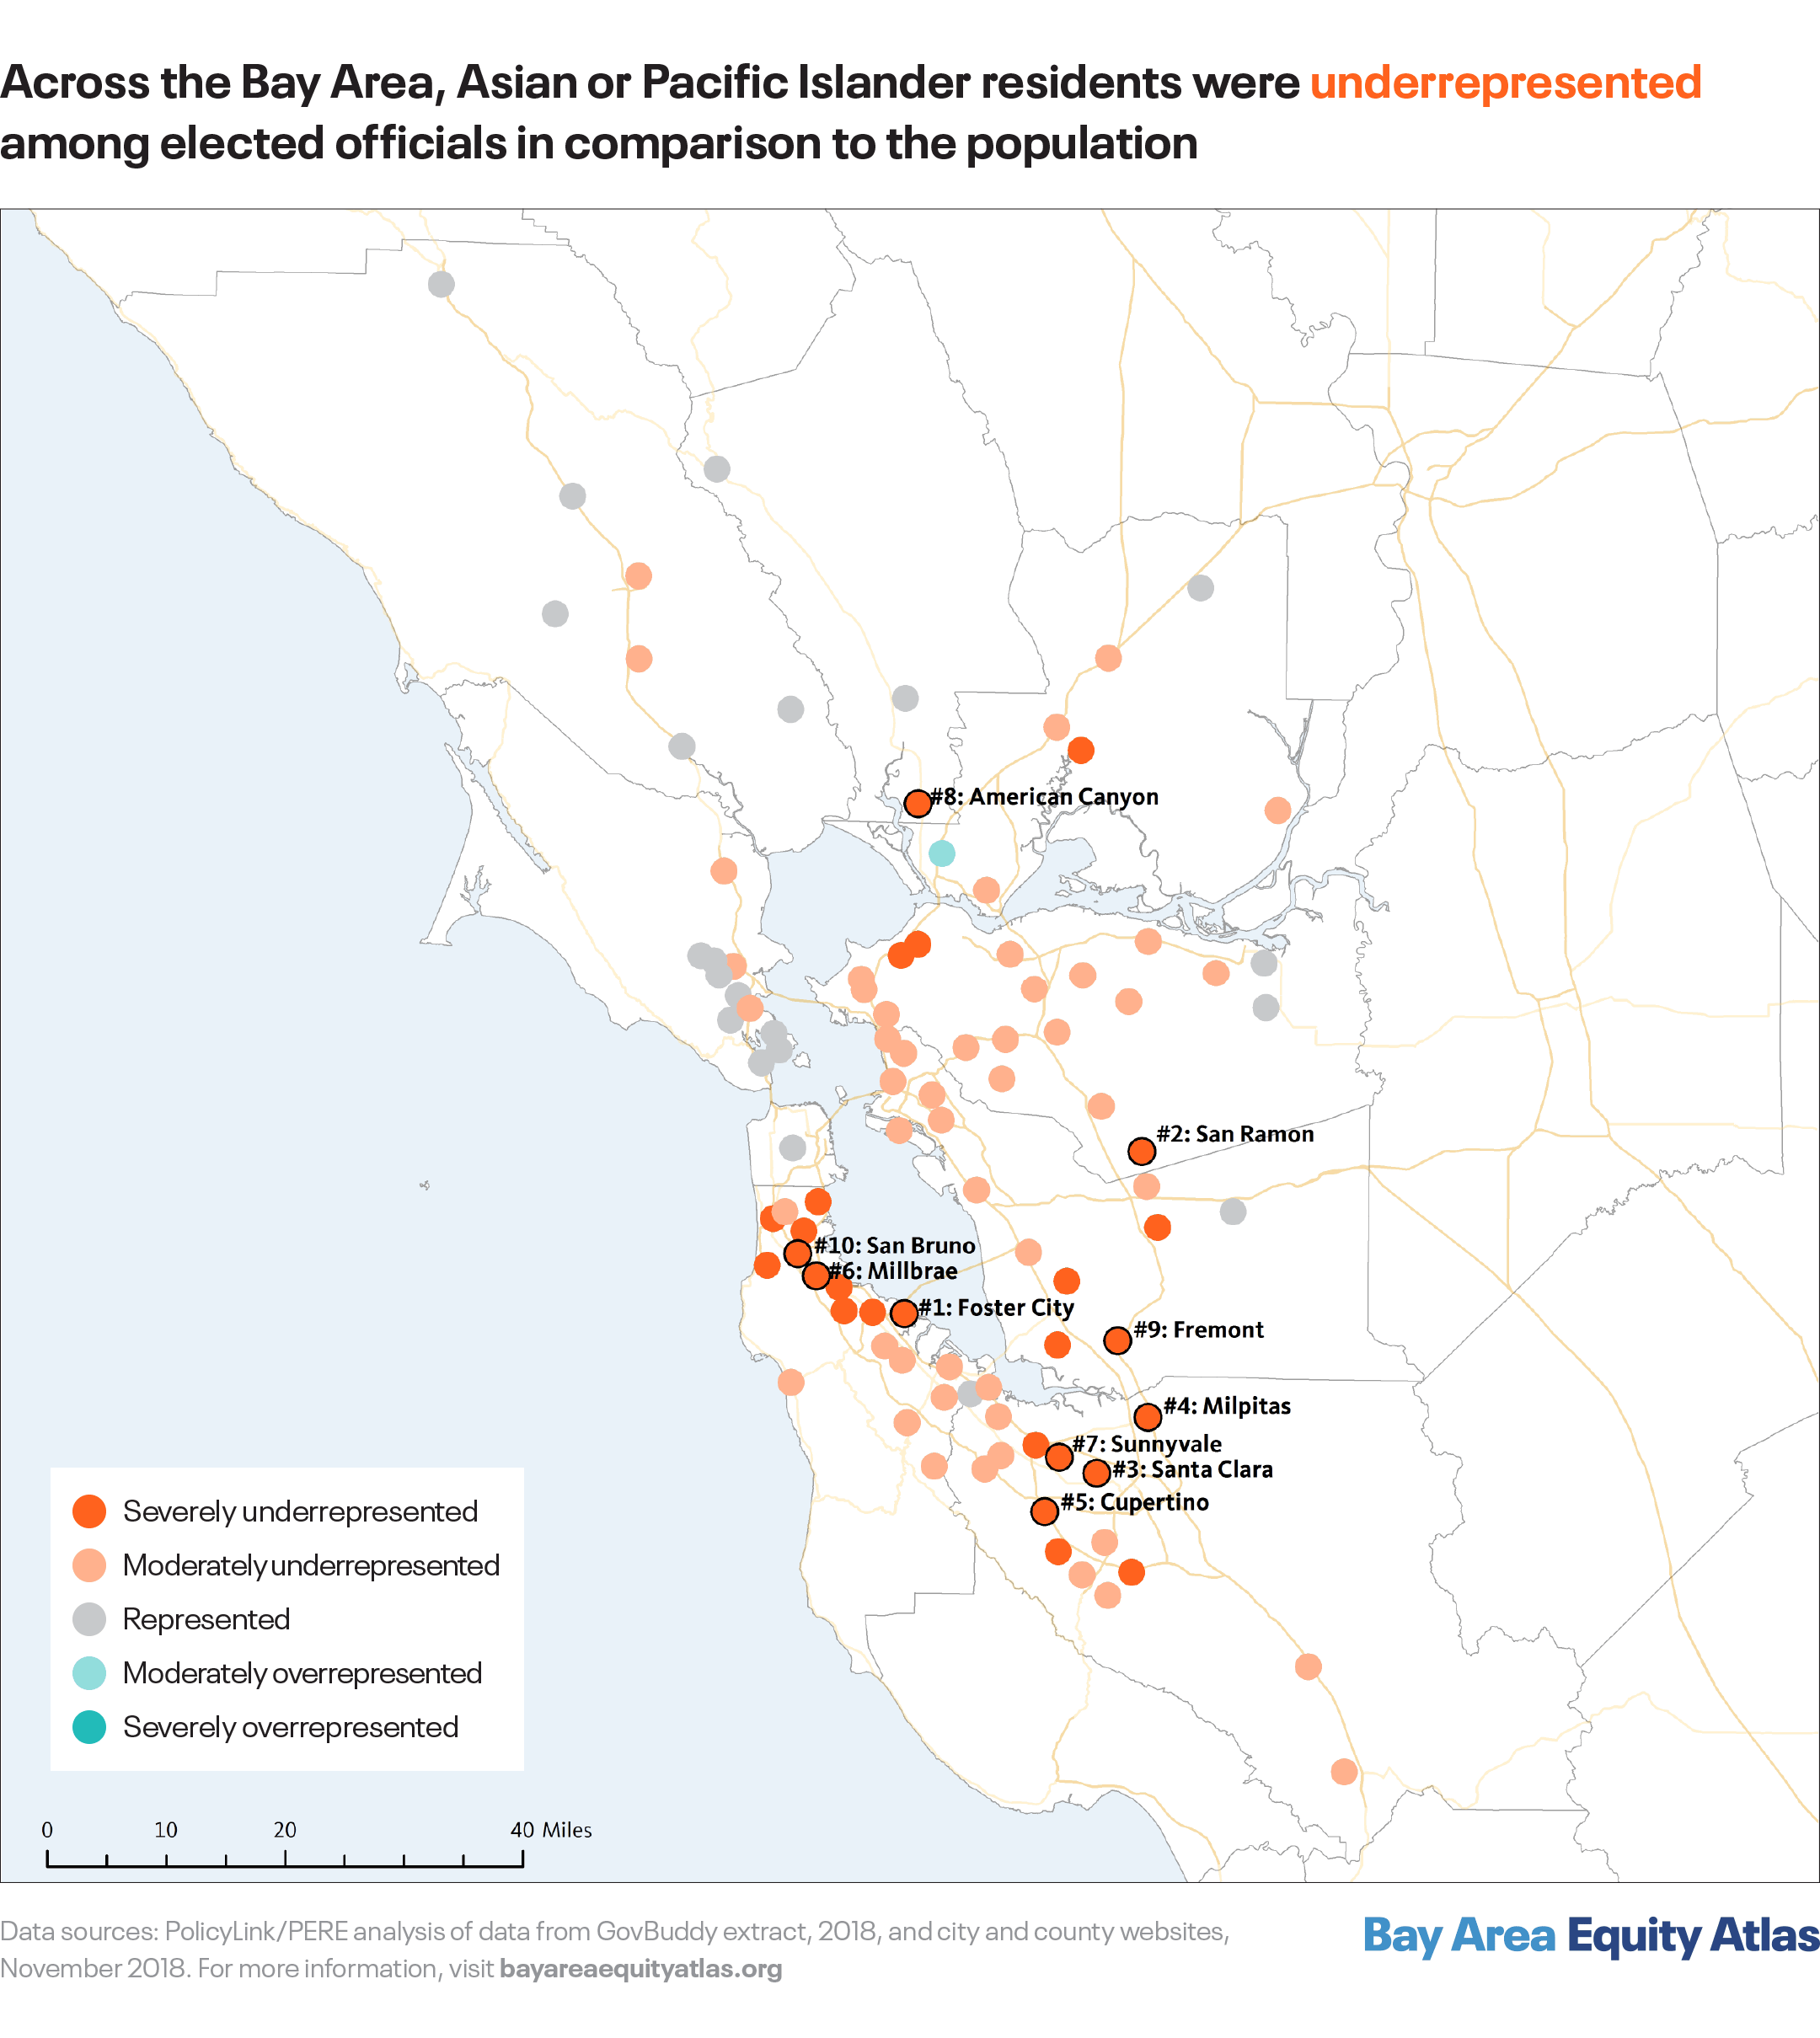
Asian or Pacific Islander Electeds: Also Underrrepresented Almost Everywhere
Asian or Pacific Islander residents are also underrepresented in most Bay Area cities and towns. In 26 municipalities, the API community was severely underrepresented among top elected officials. The worst gaps were in the cities of Foster City, San Ramon, and Santa Clara, where at least four in 10 residents are API but there are no API elected officials.4 Across Santa Clara county, 35 percent of residents are API but there are no APIs among top county electeds.

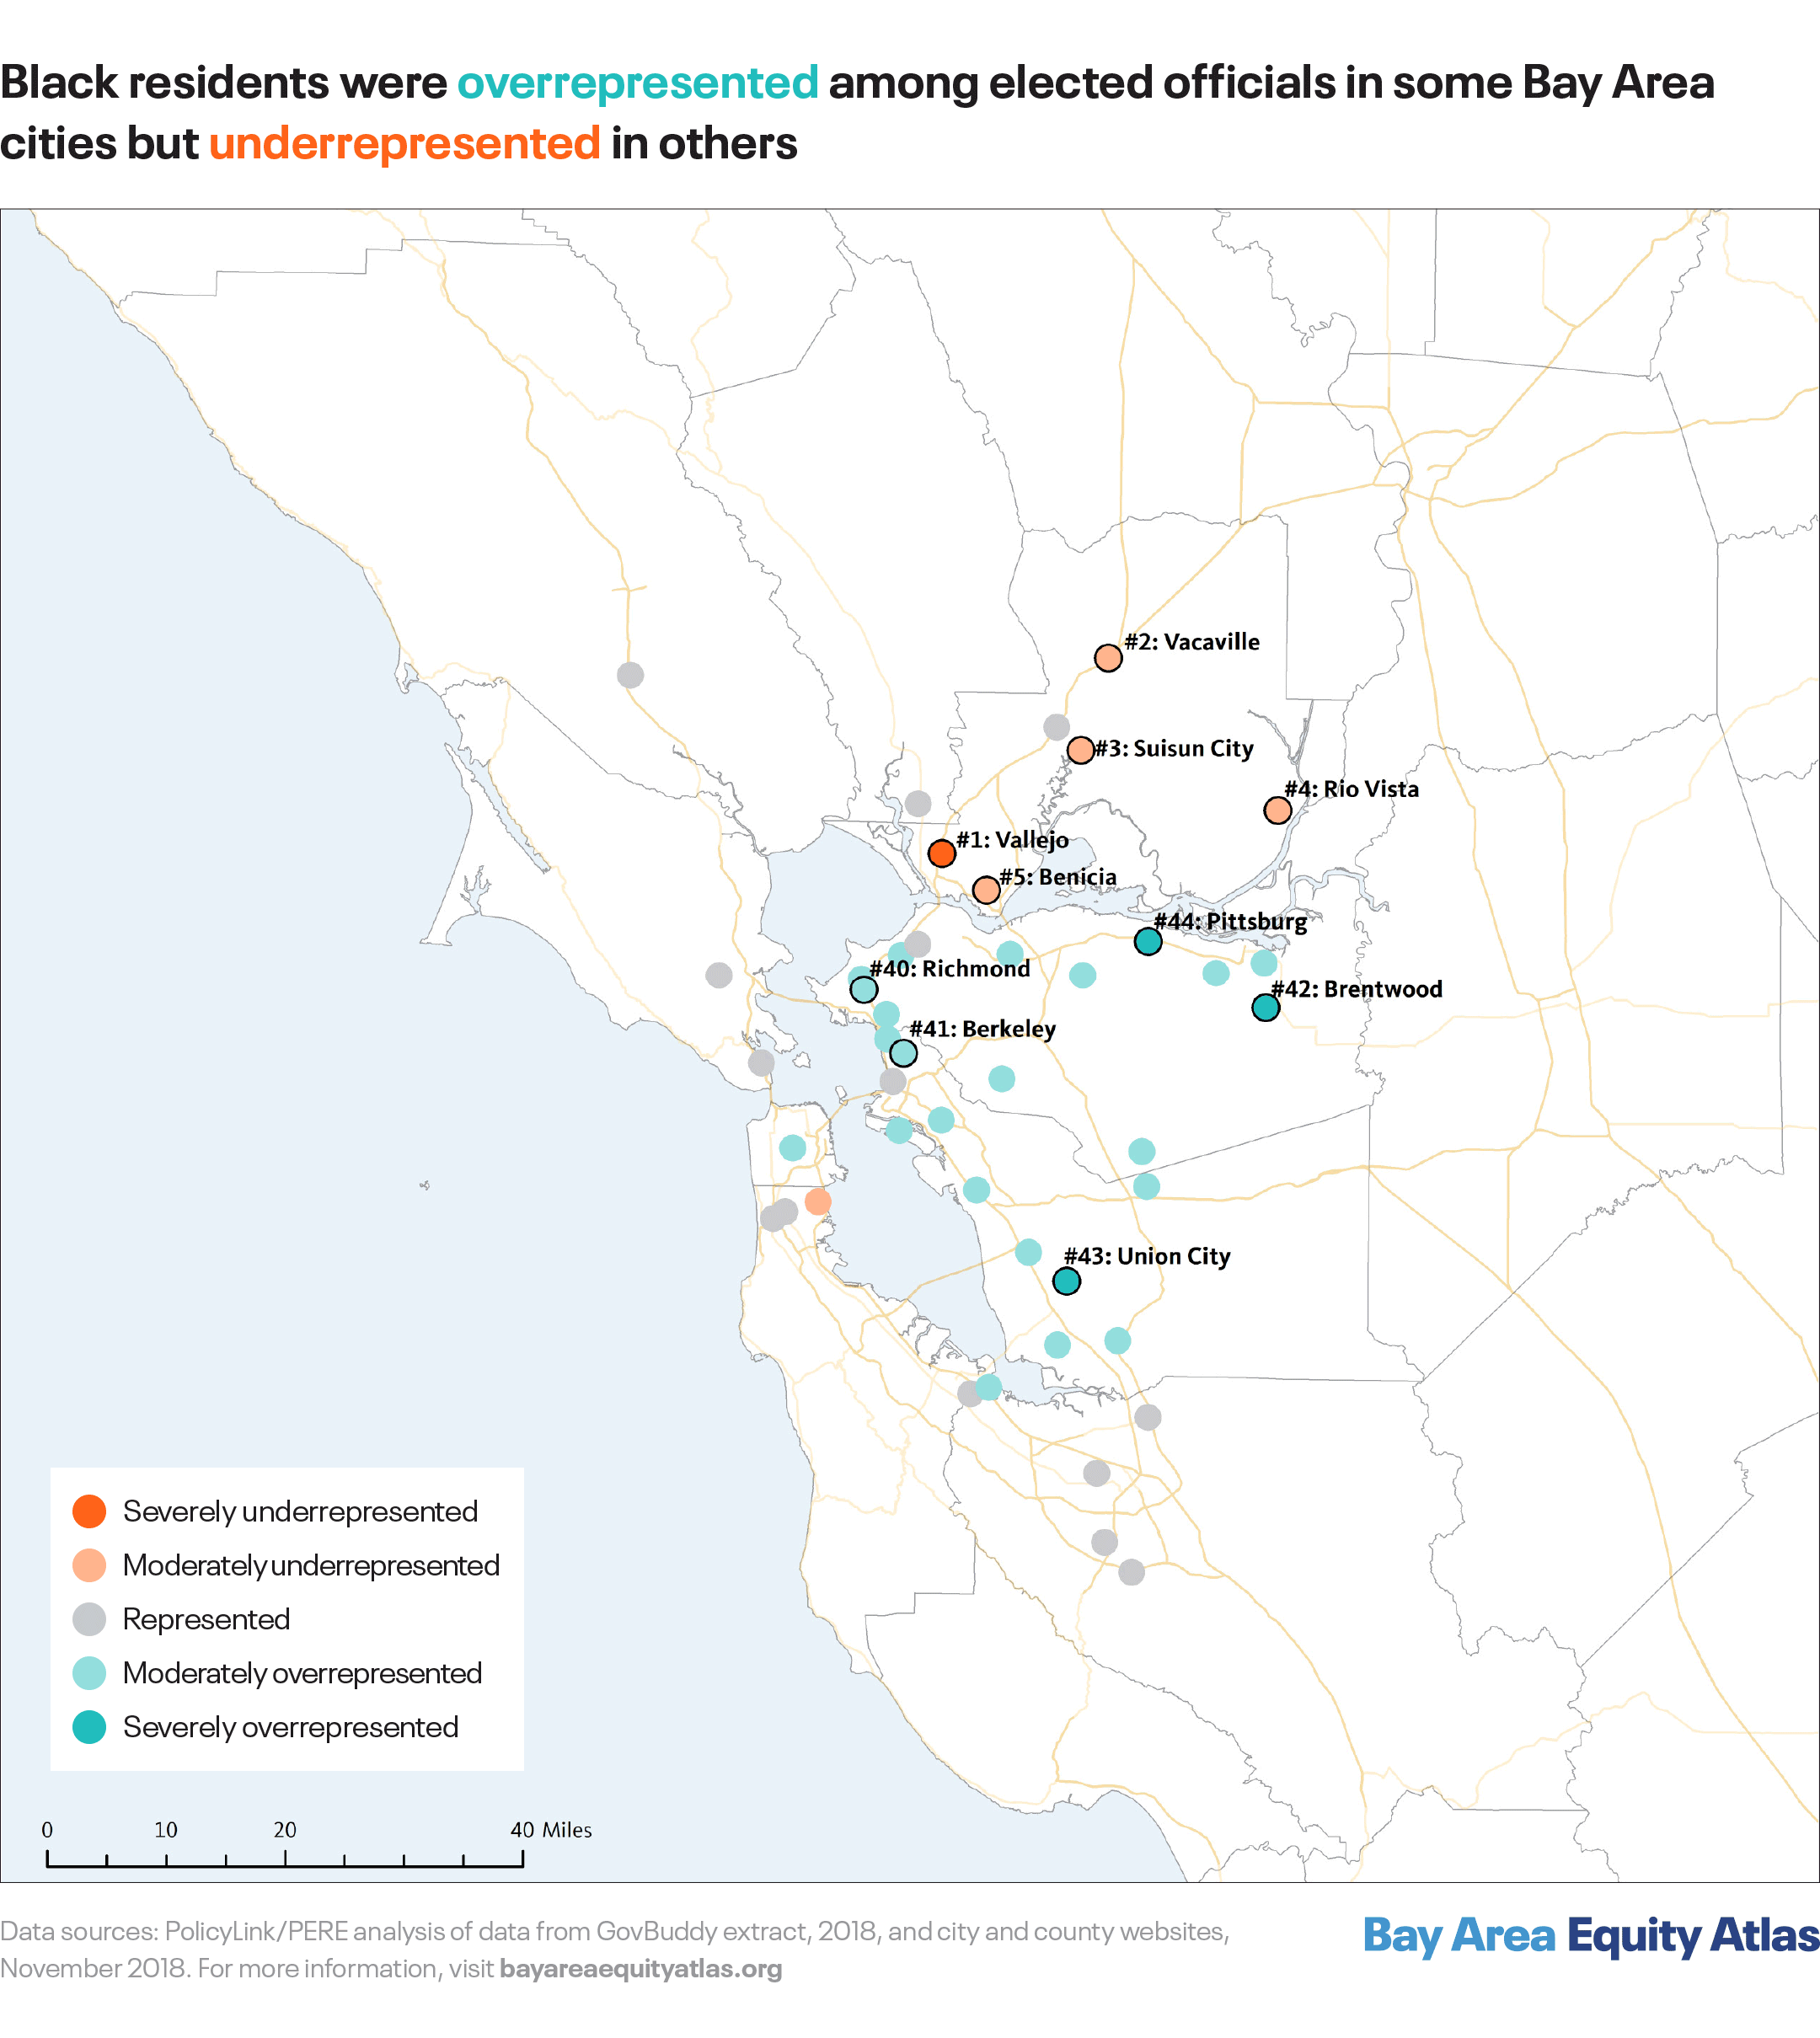
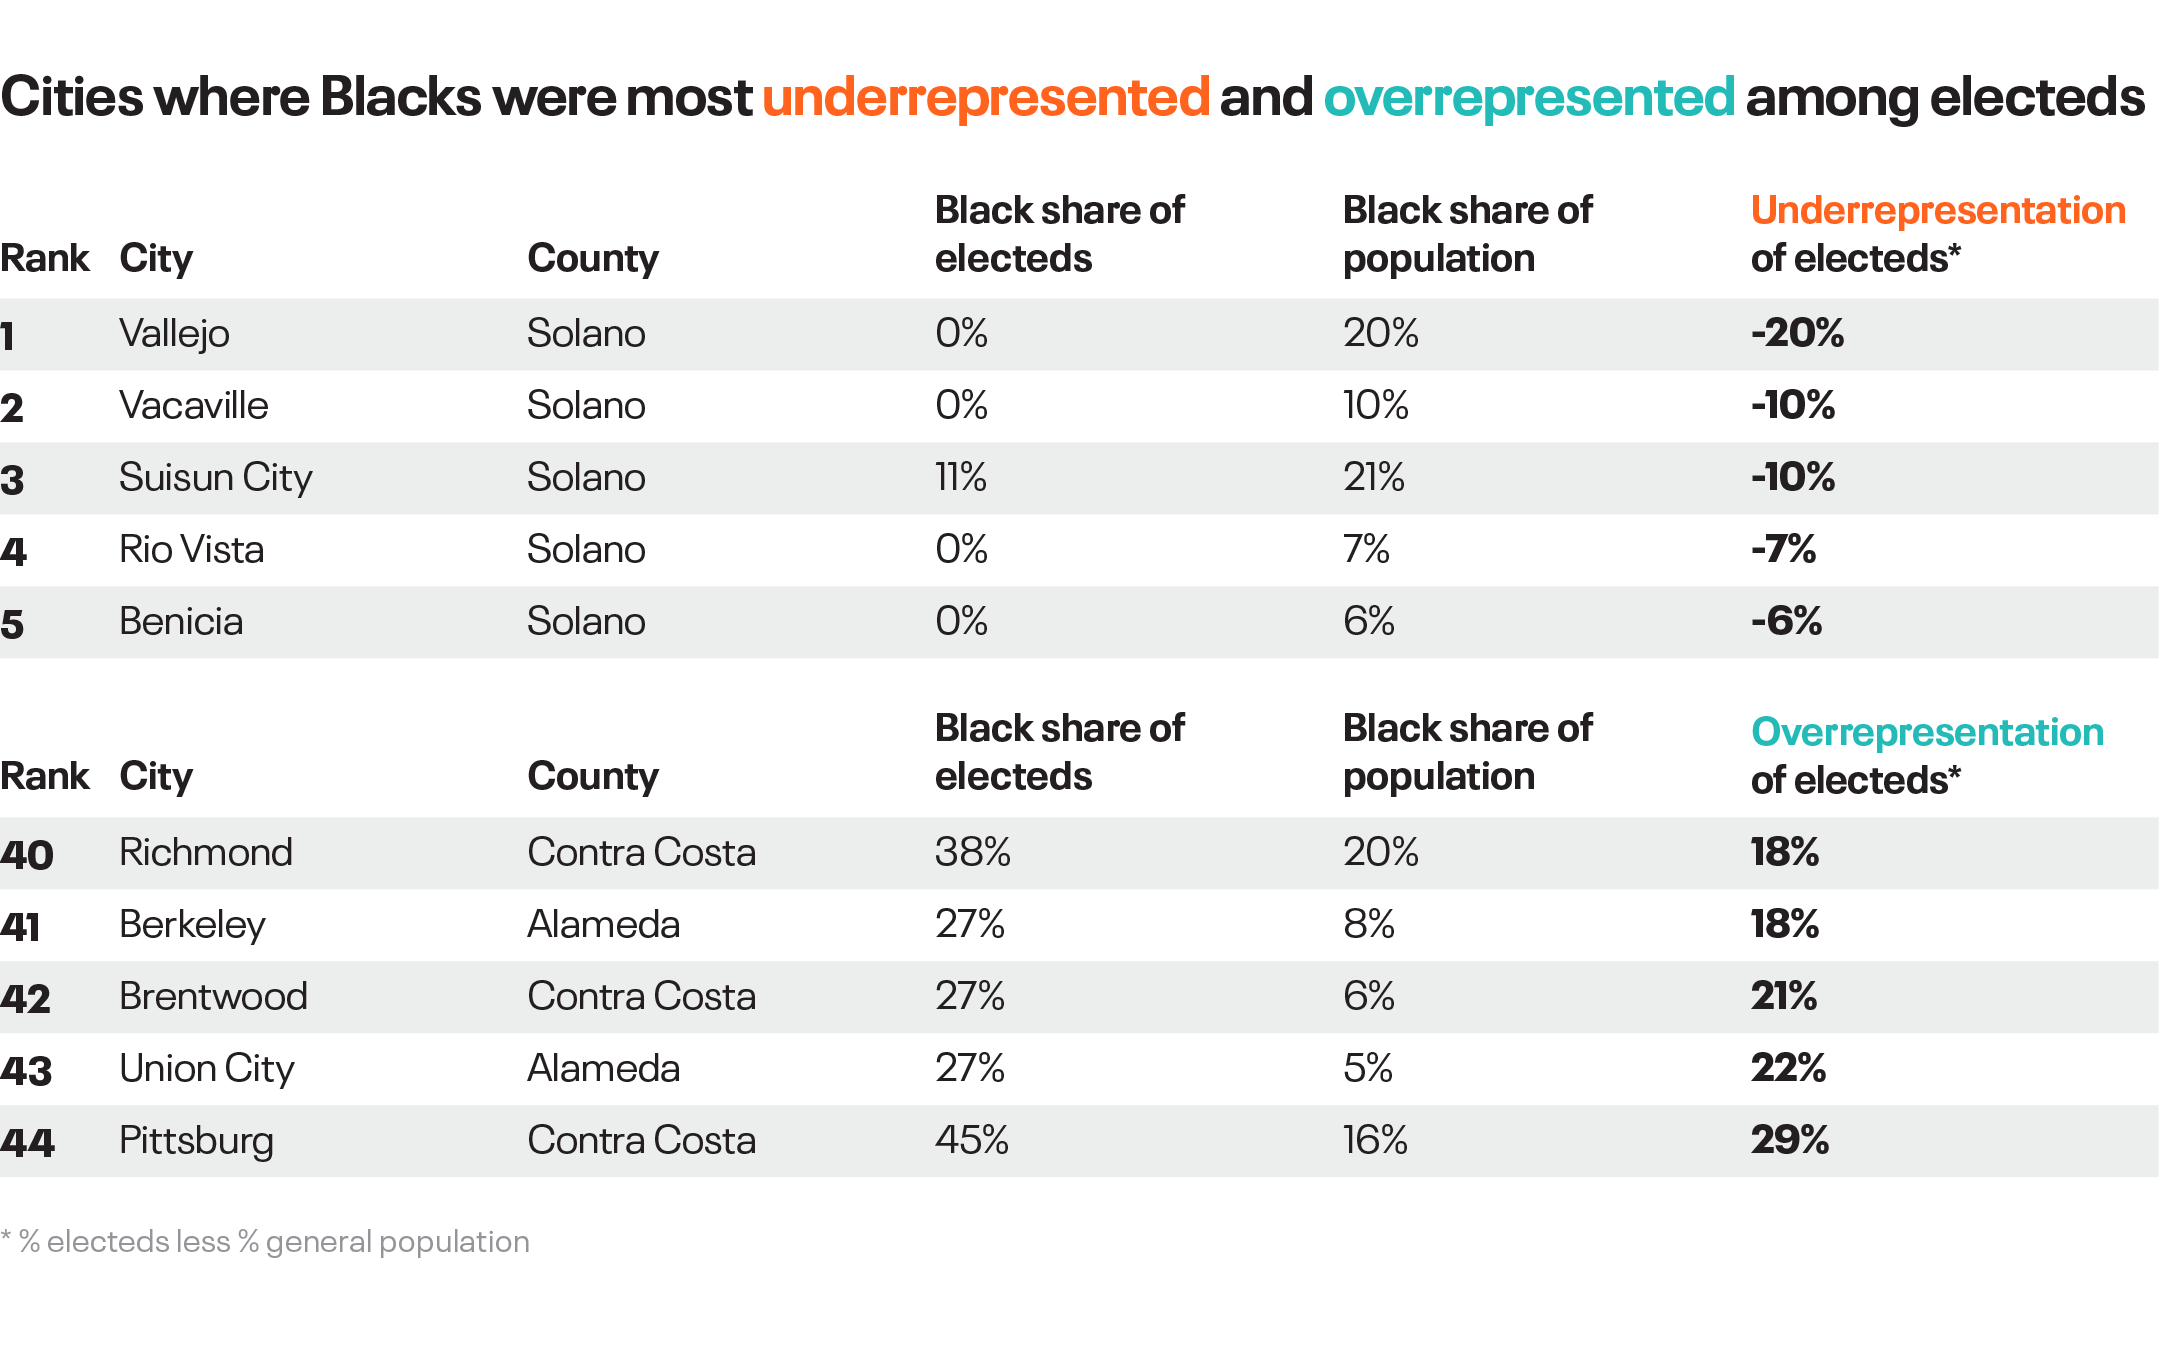
Black Elected Officials: Overrepresented in Some Cities, Underrepresented in Others
While regionwide, the share of Black elected officials equals the share of Black residents, this pattern varies across cities and towns. Among the 44 Bay Area municipalities where Black residents make up more than 3 percent of the population, Blacks are overrepresented among electeds in 24 of them (mostly moderately so), represented in 14 of them, and underrepresented in six of them. The municipality with the most Black representation among top electeds was Pittsburg, where Blacks make up 16 percent of the population and 45 percent of electeds. In Union City and Brentwood, Blacks made up 27 percent of electeds but about five and six percent of the population, respectively. Vallejo, which is 20 percent Black but had no Black electeds, was the municipality with the least Black political representation, followed by Vacaville and Suisun City. All five of the cities with an underrepresentation of Black residents are located in Solano County, where there were no Black elected officials.
Toward A More Representative Bay Area Politics
The Bay Area is famed for its diversity, yet our examination of the data reveals that top elected leaders in the region are not reflective of this diversity. Whites are overrepresented in almost every Bay Area city and town (as well as all counties), while the Latinx and Asian or Pacific Islander community are underrepresented in the vast majority of cities and towns (as well as most counties). Women are also underrepresented among top electeds and this holds true across all major racial/ethnic groups, with the exception of the Black community.
The data paint a troubling picture of skewed political power in our region. The lack of Latinx and API representation among top electeds signals a potential gap between community needs and policy priorities. This is concerning for vulnerable and excluded communities of color, but also for the cultural and economic vitality of cities and our region as a whole. Demographers project that between 2015 and 2050 the Bay Area’s Latinx and API communities will increase from 49 to 55 percent of the region’s total population. It is crucial that these communities can fully participate in and contribute to political and economic life.
To address this gap in representation, Bay Area leaders should invest in strategies that result in more candidates from underrepresented communities getting elected to city and county elected offices, especially in places where communities are severely underrepresented. Such strategies can include structural and institutional reforms such as switching from at-large to district-based elections, which can make it easier to elect candidates from communities of color, or establishing public campaign financing which addresses funding barriers. There has been some adoption of these strategies in the region: More than half-dozen Bay Area cities including Concord, Fremont, Menlo Park, Martinez, Redwood City, Santa Clara, and Sunnyvale have recently moved to district-based elections, and San Francisco and Berkeley have public campaign financing (Oakland has some limited public funding available).
Funders and business leaders should also support targeted efforts to encourage and support leaders from communities of color in running for office, as well as efforts to provide support to new elected officials once they are in office. Expanding leadership development programs that prepare people from low-income communities and communities of color to effectively engage in public policy, such as Urban Habitat’s Boards and Commission’s Leadership Institute, can also provide a stepping stone into elected office. Lastly, investing in voting reform and civic engagement efforts that increase voting among underrepresented communities is crucial to ensuring equitable political representation.
1 Using the most recent list of elected officials collected by GovBuddy (current for May 2018), we identified the race and gender of the elected officials via web-based research. We then sent the information to the elected officials via email and mail, providing them with multiple opportunities to correct the data. Note that this methodology enabled the collection of broad racial/ethnic and gender categories, but not detailed ones (e.g. specific Asian or Pacific Islander subgroups, non-binary gender identification). See our full methodology here.
2 San Francisco District 5 supervisor Vallie Brown, who was appointed to succeed supervisor London Breed after she became mayor on July 16, 2018 (after the close of data collection for this project), identifies as part Native American.
3 Santa Clara recently shifted to district elections after a civil rights lawsuit, and Indian immigrant and Sikh community member Raj Chahal was elected to office in November 2018 (after our assessment).
4 See note 3.