How Is the Black Population Doing in the Bay Area?
This dashboard shares four key indicators of equity for the Black population in the San Francisco Bay Area: economic inclusion, political representation, educational equity, and the impacts of policing.
Key Takeaways
- The region's prosperity is not equitably shared. On average, Black workers in the region earn about half of what white men earn.
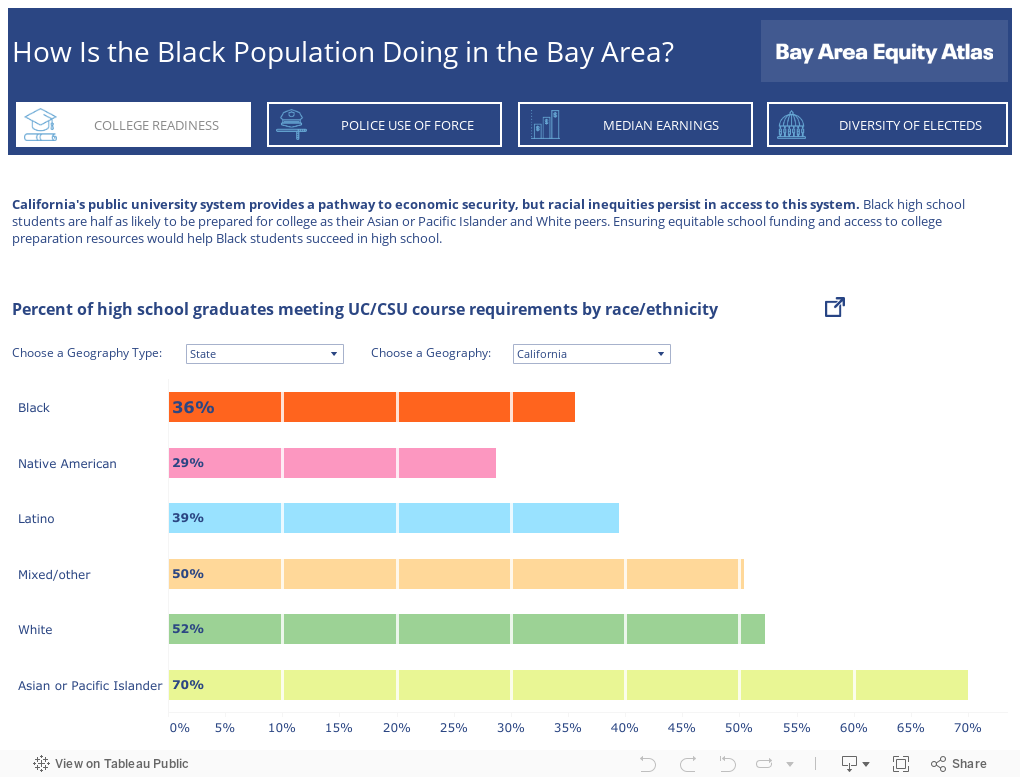
- Our education system is failing Black youth: One-third of Black high school graduates are college-ready, compared to more than half of white graduates.
- Currently, four out of five cities in the Bay Area do not have a Black elected official.
Drivers of Inequity
The racial inequities revealed in these data displays are reinforced by intentional and unintentional policy decisions related to neighborhood investment, residential segregation, labor market inequities, and overpolicing in communities of color. Lack of equity in political representation has posed challenges to advancing solutions that address these disparities.
Equity Solutions
- Create cradle-to-career pipelines for vulnerable youth and invest in universal pre-K.
- Reform harsh, “zero tolerance” school discipline policies to keep youth in school and on track to graduate.
- Ensure access to higher education for immigrant students by providing in-state tuition rates regardless of their immigrant status and by increasing access to financial aid or scholarships.
- Strengthen workers’ right to organize and bargain collectively for improvements in wages, benefits, and working conditions.
- Establish standards to ensure public investments in economic development and infrastructure to create living wage jobs.
- Pursue full employment economic policies that promote hiring, increased work hours, and rising wages for low-wage workers.
- Establish public campaign financing that addresses funding barriers for people of color seeking office.
- Expand leadership development programs that prepare people from low-income communities and communities of color to run for and win elected office, and to effectively engage in public policy.
- Strengthen democracy by increasing participation of marginalized groups and expanding voting rights (and preventing rollback).
Data Sources and Methods
The data source for college readiness comes from the California Department of Education. Police use of force data is drawn from the California Department of Justice. Data for median earnings comes from the American Community Survey (ACS). Diversity of electeds is a primary dataset of demographic information on elected officials, collected and analyzed by the Bay Area Equity Atlas.
Design Approach
To highlight our focus on the Black population, we emphasized this data through color, and focused on comparing data for the Black and White populations where possible. Our wraparound text provides insights into drivers of systemic disparities seen in the data and how they impact quality of life in the region, as well as solutions.
Created By
Created by the National Equity Atlas in partnership with Chantilly Juggernauth of Lovelytics