The Asian and Pacific Islander Population in the Bay Area is Large and Diverse and is Fueling Growth in the Region
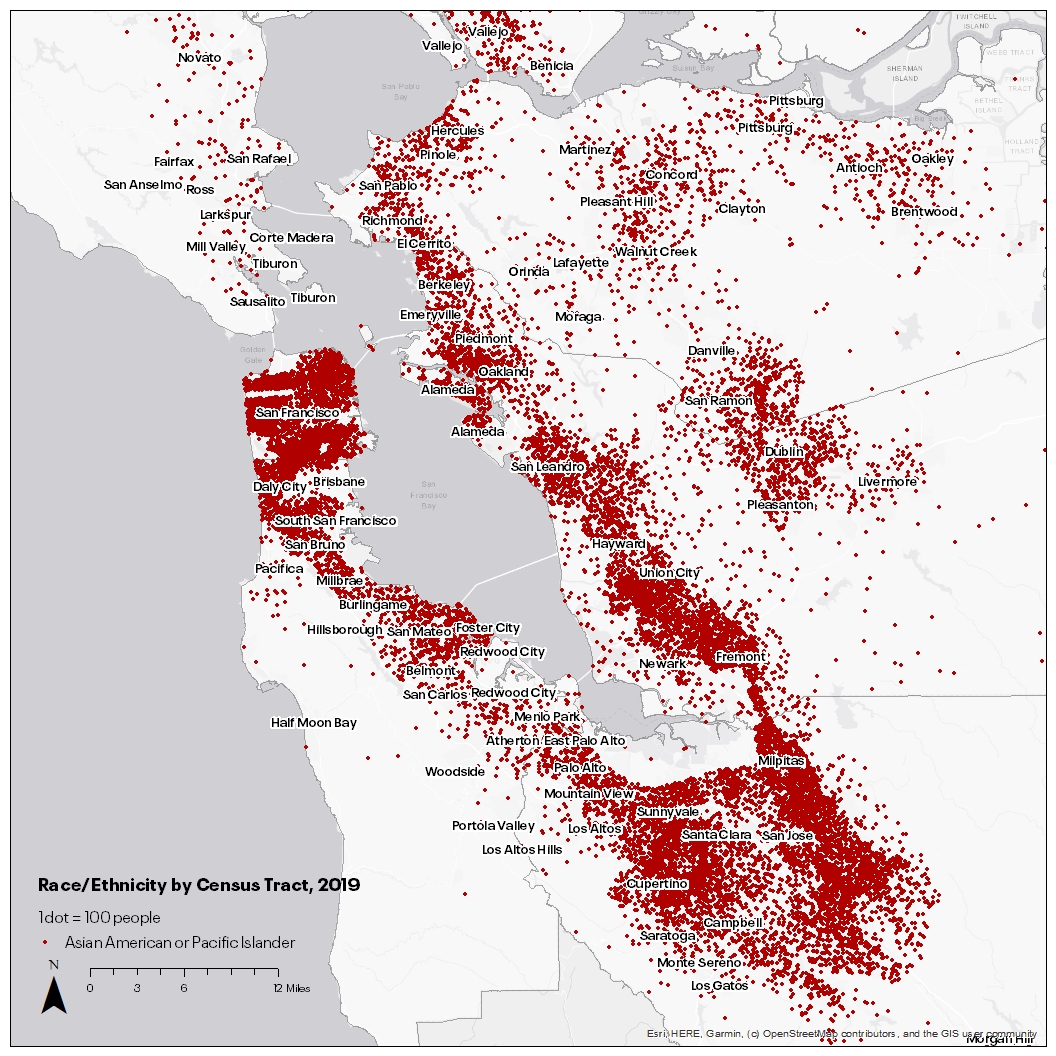
A part of the global Pacific Rim, the San Francisco Bay Area has long been home to a large Asian American community including immigrants and native-born residents. Today, 27 percent of Bay Area residents – just over two million people – identify as Asian American or Pacific Islander (API), second only to the Honolulu metro. The Bay Area’s Asian community is among its fastest-growing groups and is also incredibly diverse, representing dozens of different ancestry backgrounds and a multitude of cultures.
Providing demographic data that is disaggregated by ancestry is a critical goal of the Bay Area Equity Atlas, because we know this detailed data can help illustrate key differences within broad racial and ethnic groups. This is particularly true for the Asian American and Pacific Islander community both because if its diversity and because the strong performance of some API groups on important measures of social and economic well-being can mask important disparities, challenges, and barriers faced by other API groups.
For example, our housing burden indicator shows that among broad racial/ethnic groups, Asian American and Pacific Islander renters are the least likely to pay unaffordable rent: 40 percent are rent-burdened, compared with 47 percent of all Bay Area renters and 60 percent of Black renters, who face the highest rates of unaffordability. Yet, 59 percent of Vietnamese renters are rent-burdened, making them one of the most impacted populations on this important indicator of housing security. Policymakers or housing advocates looking only at the broad racial/ethnic groups without examining the more detailed ancestry data might miss this population, hindering the development of equitable policies to address this issue.
As regional leaders develop economic recovery strategies that address the disparate negative impacts of the pandemic as well as longstanding inequities, they must consider the needs of the region’s Asian and Pacific Islander communities. Some API communities in the region were hit harder by the pandemic’s health and economic impacts. Some are hard to reach because of linguistic barriers: One in five Asian or Pacific Islander households are linguistically isolated, meaning that no member of the household age 14 and above speaks English “very well.” Among Vietnamese households, 34 percent are linguistically isolated. Some face barriers to economic security and mobility. In addition, the documented increase in hate crimes and violence targeting Asian residents since the beginning of the pandemic underscores the persistence of anti-Asian racism throughout the region, affecting many API sub-communities.
This analysis provides a portrait of the Bay Area’s Asian and Pacific Islander community, using our recently-added 2019 American Community Survey data to describe the diversity of the population and to map where more than a dozen Asian sub-communities live across the nine-county region.
The Fastest Growing Group in the Bay Area
Asian American and Pacific Islander populations have lived and worked in the San Francisco Bay Area as far back as the gold rush and the construction of the Trans-Atlantic Railroad and continue to be a vital and large part of the Bay Area community. Asian Americans and Pacific Islanders account for over one quarter (27 percent) of the population in the nine-county Bay Area, and the majority are immigrants (64 percent). From 2000 to 2019, the Asian American and Pacific Islander population grew by 57 percent —the fastest growth of any racial/ethnic group in the Bay Area during that period. The Chinese population is the largest API ancestry group (30 percent of all APIs), followed by the Indian and Filipinx (each 16 percent), Vietnamese (8 percent), Korean (4 percent), Japanese (3 percent), and Taiwanese populations (2 percent).

API Populations are Geographically Spread Throughout the Region
The chart below depicts several ancestry groups as a share of the total Asian or Pacific Islander population by county (not all ancestry groups in the region are shown). People of Chinese ancestry make up 53 percent of the API population in the city and county of San Francisco, much higher than the regional average of 30 percent. Chinese residents are a much smaller share of API populations in Napa and Solano counties (8 and 7 percent, respectively). People of Indian ancestry account for 16 percent of the region’s API population and a similar or slightly larger share in Alameda, Contra Costa, Marin, and Santa Clara counties, but less than 10 percent in San Francisco and San Mateo counties and in the North Bay. Filipinx residents represent 16 percent of the API population in the region overall, but make up half of the API population in Napa and Solano counties. About 16 percent of the API population in Santa Clara County is Vietnamese, which is double the regional share for this population. Korean residents account for less than 5 percent of APIs in the region and in most counties except for Sonoma (6 percent). People of Japanese ancestry make up a small share of the API population in several counties in the region, with higher shares in Marin (10 percent) and Sonoma counties (7 percent). Pacific Islanders make up 2 percent of Bay Area APIs, but double that share in Solano County. Pakistani residents are a relatively small share of Bay Area APIs as well (1 percent) and make up a similar share across several counties including Alameda, Contra Costa, San Mateo, and Santa Clara.
Understanding Spatial Trends Can Help to Target Outreach
Understanding where specific API communities live can help foundations and community-based organizations effectively target resources and programs to the communities who need them most. Looking at API communities regionwide reveals a wide distribution of diverse populations across Bay Area cities, including San Francisco, communities along the Peninsula and in San Jose, and in cities and towns throughout the East Bay.
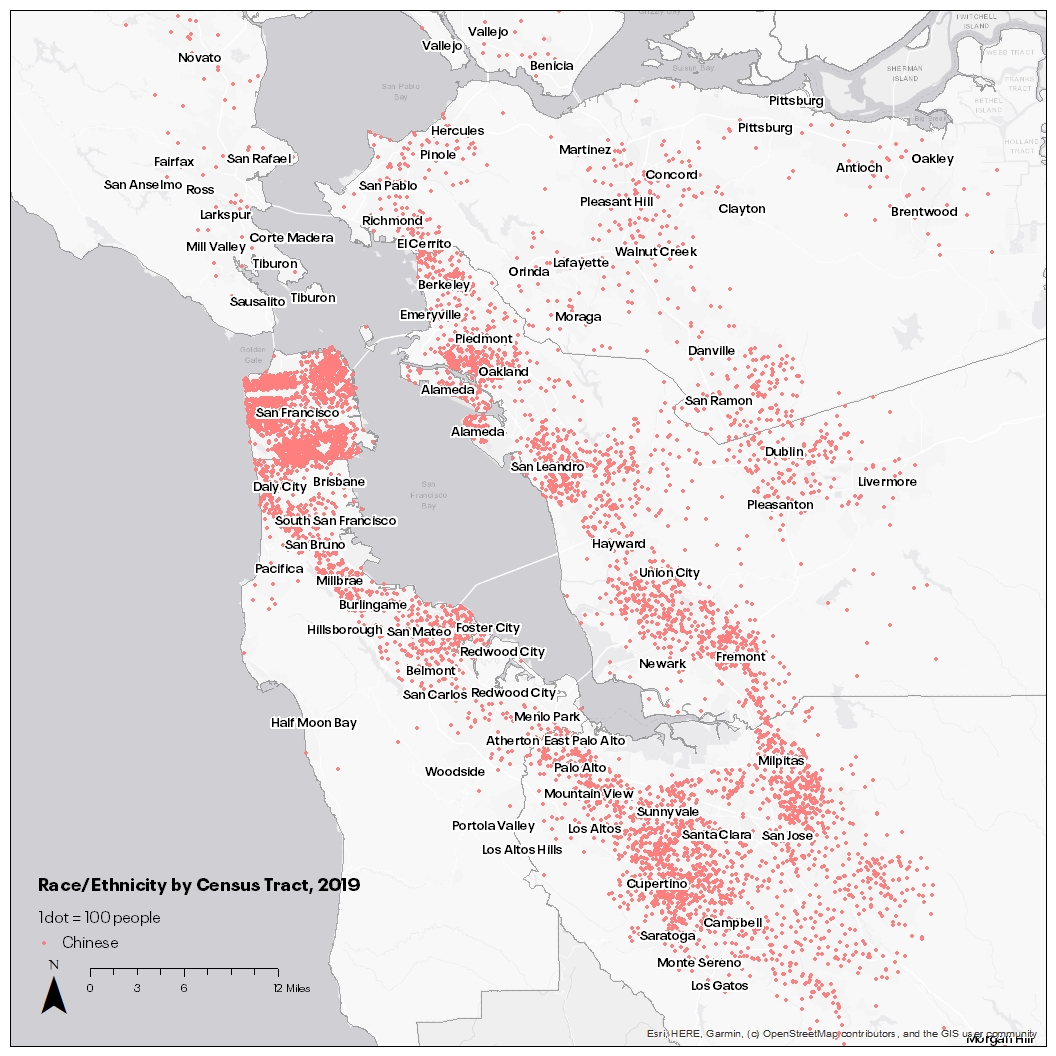
Chinese Populations are Concentrated in San Francisco and Oakland in Particular, but Live throughout the Bay Area
A look at those with Chinese ancestry highlights large populations in the City of San Francisco and along the Peninsula in places like San Mateo, and in South Bay cities of Cupertino and San Jose. In the East Bay there are similarly large concentrations of Chinese residents in parts of Oakland and Alameda and in the cities of San Leandro and Union City.
Indian Populations are Concentrated in Silicon Valley and East Bay Cities Like Fremont and Dublin
Indian communities in the Bay Area are largely concentrated in the East and South Bay and in San Francisco neighborhoods like the Financial District and Polk neighborhood. In the South Bay there are large Indian populations in Santa Clara, Mountain View, Cupertino, Milpitas, and northern San Jose. Moving north along the Peninsula there are pockets of Indian communities in San Mateo. In the East Bay, Indian populations live in Fremont and Union City. Indian communities also live further inland in the communities of Dublin and San Ramon.

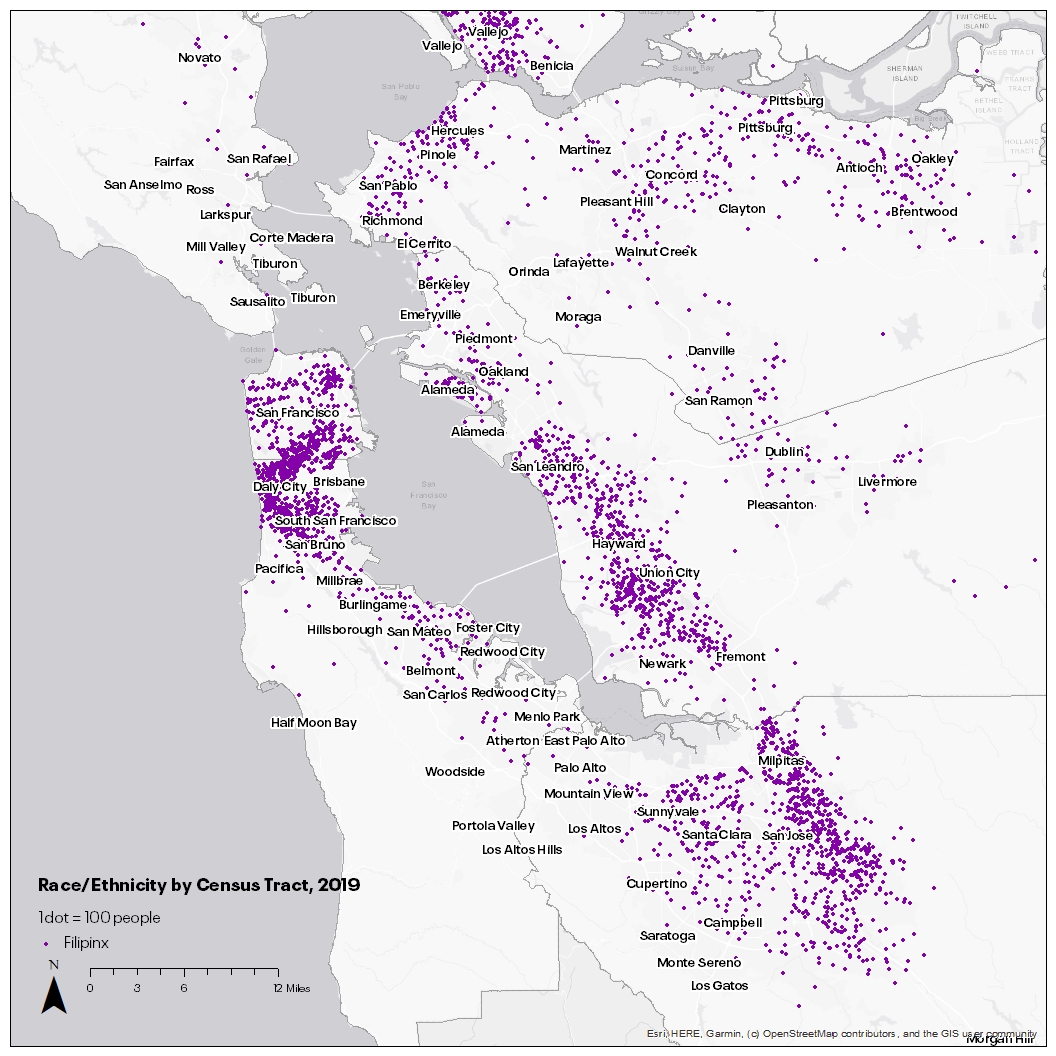
Filipinx Populations Live throughout the Region with Concentrations in San Francisco and Daly City
Filipinx communities are widely distributed throughout the Bay Area. There are large concentrations of Filipinx populations in the San Francisco neighborhoods of Park Merced, the Outer Mission, and Excelsior neighborhoods heading into Daly City. In the South Bay there are large Filipinx populations in Milpitas and East San Jose. In the East Bay, there are pockets in Union City and Hayward. Other cities with large concentrations of Filipinx populations include Hercules and Vallejo.
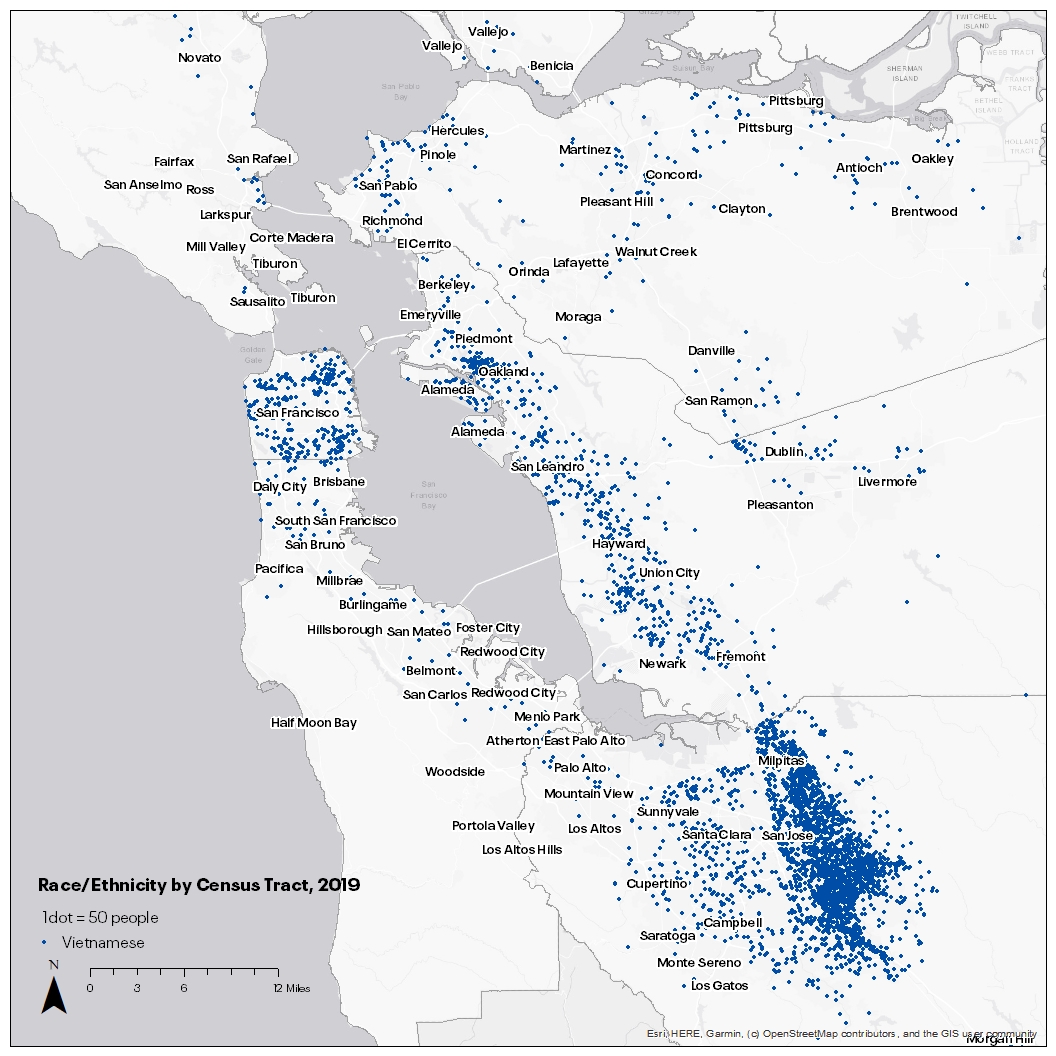
Vietnamese Populations are Largely Concentrated in San Jose and Other South Bay Communities
San Jose is home to one of the largest Vietnamese communities in the country. This population extends northward into Milpitas as well. In San Francisco, Vietnamese communities are located throughout the Sunset and Richmond neighborhoods and in parts of the Polk and Civic Center neighborhoods near Little Saigon. Finally, there is a large concentration of Vietnamese populations in Alameda and Oakland.
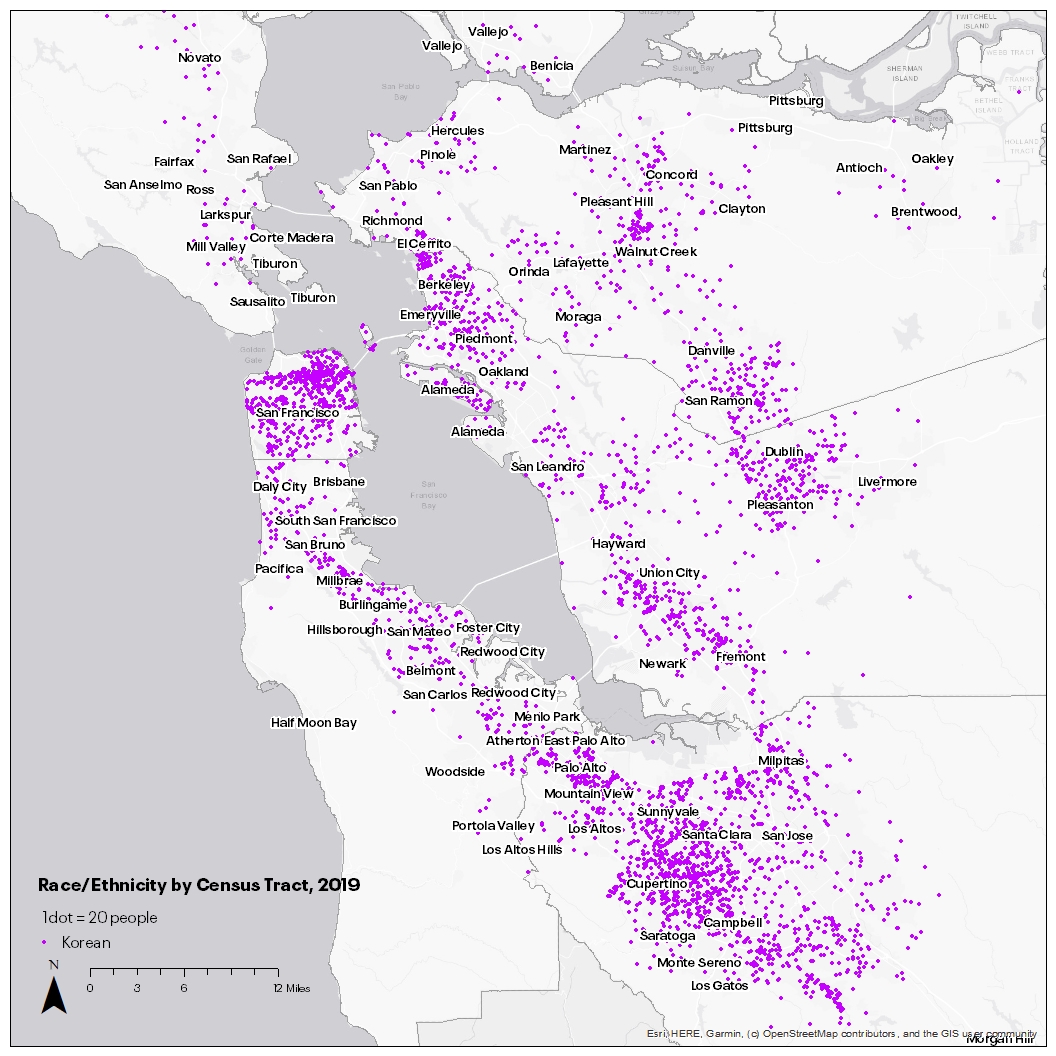
Korean Populations Live in San Francisco, Silicon Valley, and East Bay Cities Like Berkeley and Walnut Creek
Korean communities live throughout the nine-county Bay Area. In San Francisco there are large concentrations of Koreans throughout the Sunset and Richmond Districts. In the South Bay, Korean communities are widespread with large concentrations in Mountain View, Sunnyvale, Santa Clara, Cupertino, West San Jose, and Campbell. Moving to the East Bay there are Korean populations in Berkeley, El Cerrito, and parts of Oakland, with concentrations further inland in Pleasant Hill, Concord, and Walnut Creek. Smaller communities of Koreans also live in inland communities of San Ramon, Dublin, and Pleasanton.
Japanese Populations Live in San Francisco, Along the Peninsula into the South Bay, and in the East Bay
The Japanese community is more widely dispersed than other communities, with large concentrations in the Richmond and Sunset Districts of San Francisco. This relates to the fact that Japanese families were displaced during internment and many relocated to the Central Valley instead back to the Bay Area. On the Peninsula, there are large populations in San Mateo. Japanese populations also live throughout the South Bay in the cities of Mountain View, Sunnyvale, Santa Clara, and San Jose. In the East Bay, there are Japanese populations in Berkley, Albany, and El Cerrito. The Bay Area is home to two of the last Japantowns in the nation.

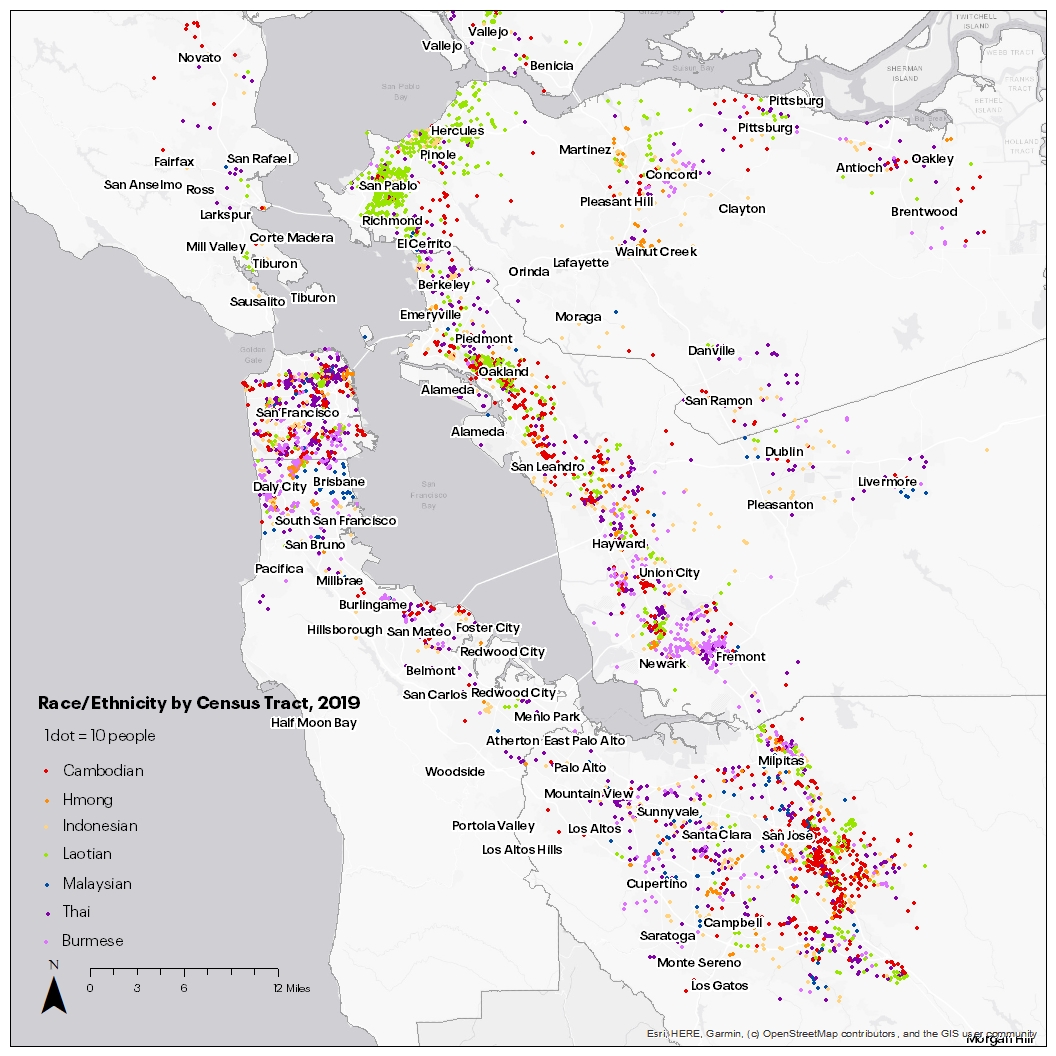
Southeast Asians Live in Richmond, San Francisco, Daly City, San Jose, and Oakland
While the Bay Area is home to some of the largest communities of Filipinx and Vietnamese Americans in the country, it is also home to many other Southeast Asians. San Francisco neighborhoods like the Financial District, Polk, the Tenderloin, and SOMA are home to Thai communities. The Burmese population has settled in parts of Daly City, and in Fremont in the East Bay. The Laotian population is largely concentrated in Richmond, El Sobrante, Pinole, and Hercules. Smaller pockets of Malaysian communities also live in Brisbane, San Jose, and Livermore, while a small Hmong community exists in Concord, Walnut Creek, and San Jose. Lastly, Cambodian populations live in parts of Oakland and East San Jose.
South Asians are Concentrated in West Contra Costa County Communities and East Bay Cities Such as Fremont
In addition to Indian communities, the Bay Area is home to many other South Asians. There is a large Pakistani community in Fremont and throughout the East Bay in the cities of San Ramon, Dublin, and Pleasanton. There are also Nepalese communities in Sunnyvale, Berkeley, and El Cerrito. Far inland in the city of Antioch, there is a small community of Sri Lankans. Small Bangladeshi communities can also be found in Concord, Livermore, and Oakland.

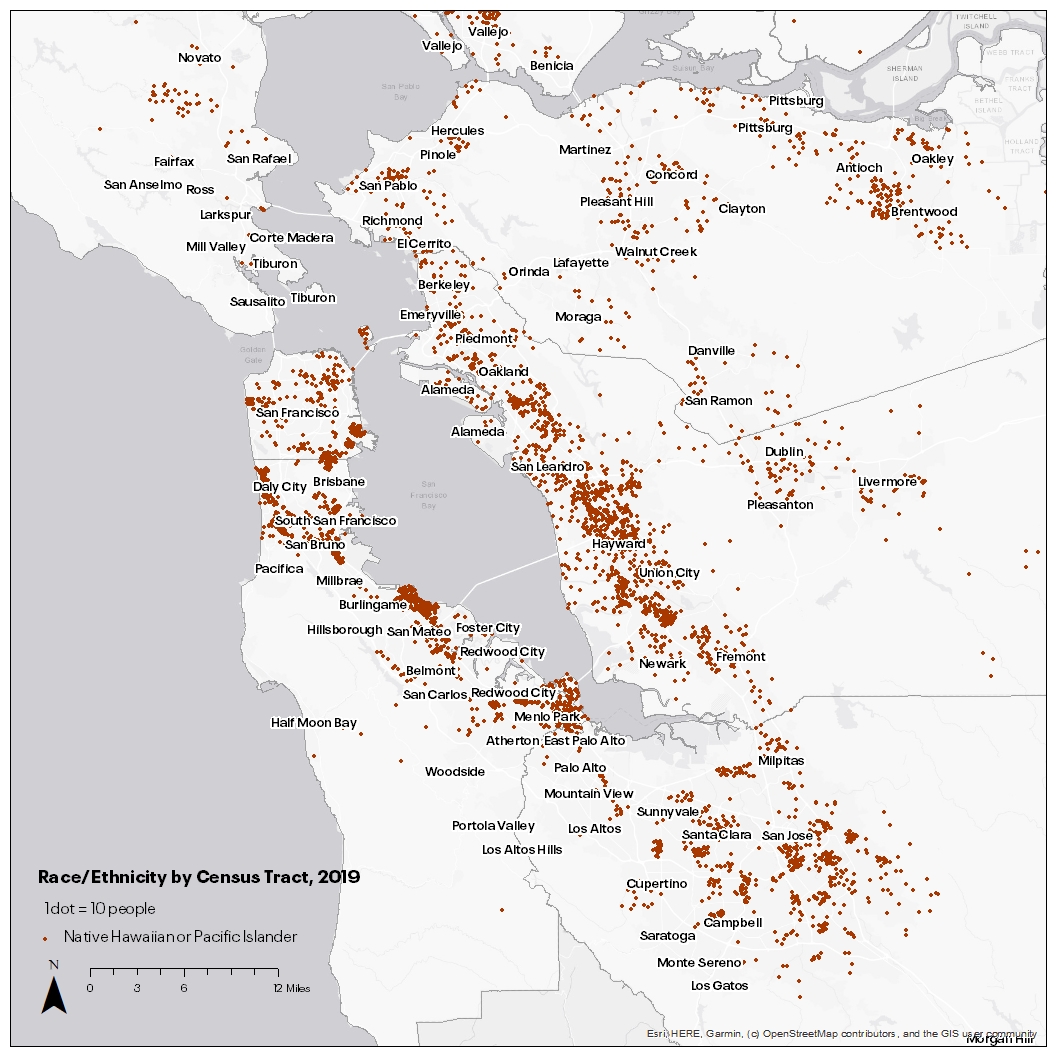
Pacific Islanders are Concentrated in San Francisco, East Palo Alto, and Hayward
Pacific Islanders are a diverse group but given their smaller population must be aggregated in order to see spatial patterns. This community is more concentrated geographically compared with other groups. In San Francisco there is a large concentration in the Bay View, Hunters Point, Visitacion Valley, and Park Merced neighborhoods. Moving along the Peninsula, there are large communities in San Bruno, Millbrae, Burlingame, East Palo Alto, and San Mateo. In the East Bay, Pacific Islanders are more widely dispersed throughout Oakland, San Leandro, Hayward, Union City, and Fremont.
Deeply Disaggregated Data Is Crucial for an Equitable Recovery and Inclusive Growth
Granular data that illuminates inequities both between and within different populations is a critical ingredient for advancing an equitable recovery and promoting equitable policy and systems change. Asian American and Pacific Islander communities in the Bay Area represent a wealth of diversity. Data that show the richness of these communities as well as the challenges facing specific populations can help foster a region where all can participate and thrive, through equity-focused strategies such as those listed below.
- Ensure recovery efforts, including vaccination rollouts and rent relief programs, provide culturally-relevant services in multiple languages to reach all populations in the region, including immigrants, undocumented populations, low-income communities, and seniors.
- Center the experiences of marginalized groups and bring critical community knowledge to decision-making processes through increased political representation of APIs and other people of color.
- To ensure all communities receive adequate funding and resources, the Census Bureau should correct decennial counts if its post-enumeration surveys (scheduled for release in 2022) indicate undercounting, especially for hard-to-reach populations including low-income populations, immigrants, and people of color.
- Promote the well-being of immigrants and their families across California with data on immigrant integration disaggregated by immigration status, race, and ancestry from the California Immigrant Data Portal.
Photo: "Parol Lantern Festival" by kumasawa is licensed under CC BY-NC-ND 2.0